.svg)


Market Insights Snapshot
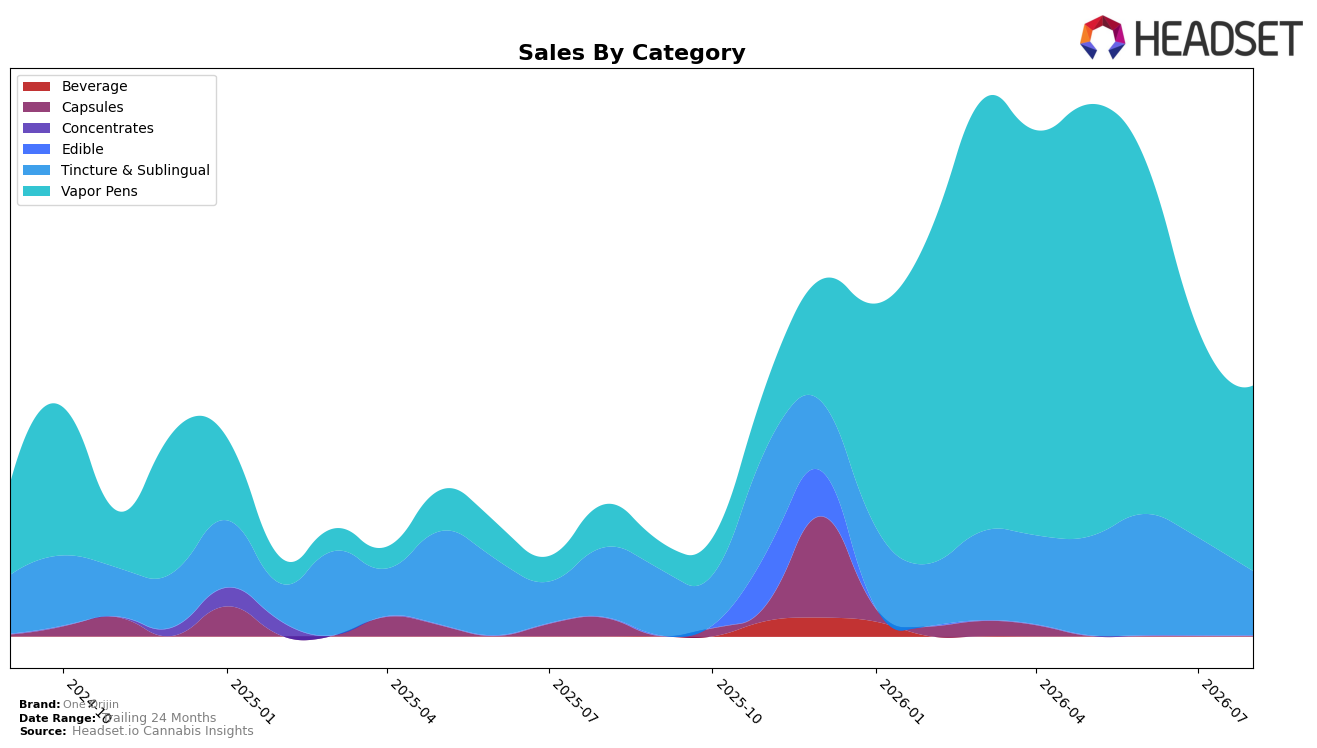
One Orijin concentrated 74.39% of August 2026 sales in Vapor Pens, ranking 78 in Vapor Pens in Ohio while that category posted 335.04% YoY growth and a -10.97% MoM decline; Tincture & Sublingual held 25.61% share with -7.73% YoY and -34.51% MoM. Despite brand-level sales up 91.60% YoY and average price down 19.52%, the category split shifted toward Vapor Pens as Tincture & Sublingual contracted sharply, implying a deliberate tilt to higher-velocity form factors even as overall MoM momentum softened.
The divergence between a 335.04% YoY surge in Vapor Pens and a -7.73% YoY slide in Tincture & Sublingual, combined with a -10.97% vs. -34.51% MoM gap, indicates One Orijin is consolidating demand into a single lead segment while using lower average prices ($27.68) to expand unit throughput. With 74.39% mix in Vapor Pens but a 78 rank in Ohio, the pattern implies headroom: sustaining share gains will likely depend on translating the YoY-heavy Vapor Pen growth into improved rank while preventing Tincture & Sublingual’s 25.61% slice from becoming a drag on month-to-month stability.
Competitive Landscape
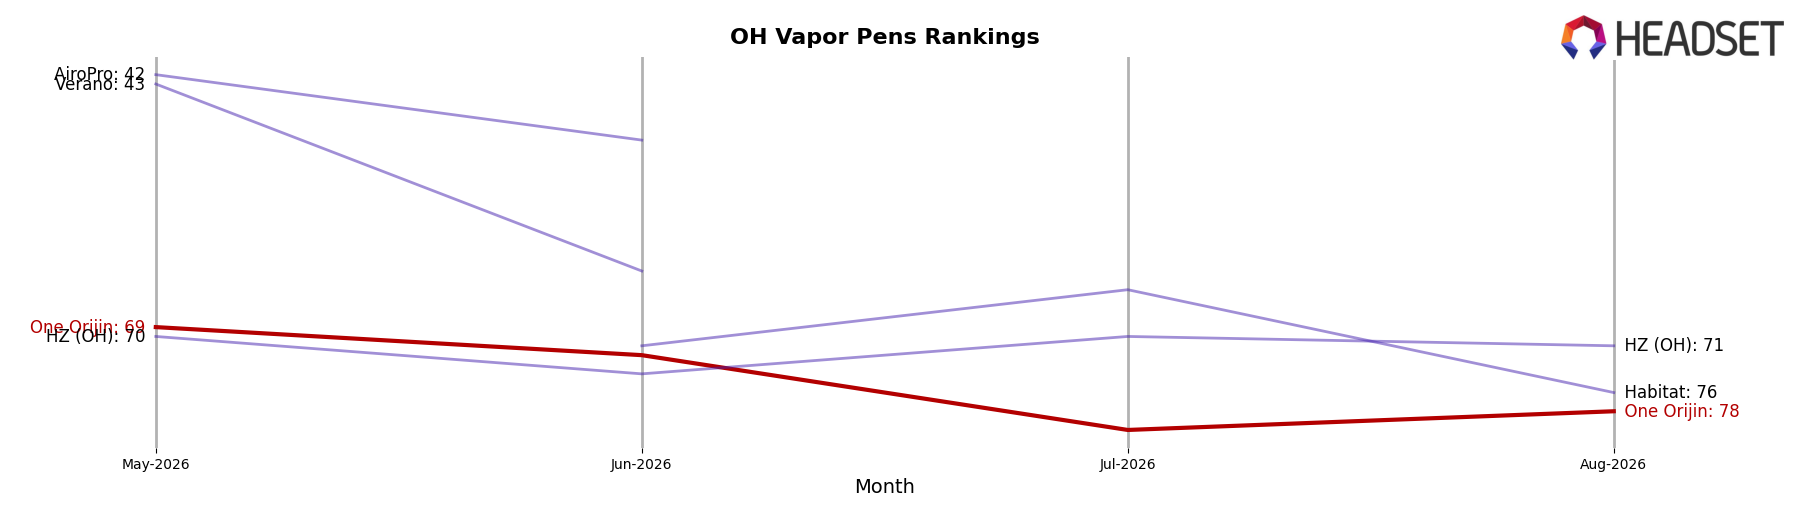
One Orijin ranks #78 in OH Vapor Pens in August 2026, improving 14 positions from #92 year over year but slipping 9 spots from #69 in May 2026 and sitting 10 places below its April 2026 peak at #68; meanwhile, Rove climbed from #10 to #3 while growing sales 84.6%, and Certified (Certified Cultivators) held #1 with 68.2% YoY sales growth, indicating that One Orijin’s modest rank recovery amid faster-rising leaders points to a mid-pack squeeze where maintaining gains will require outperforming brands that are advancing multiple ranks per year.
Notable Products
CBD/THC 1:1 4 Day Tincture (440mg CBD, 440mg THC, 30ml) posted the steepest movement in August 2026 with a -34.5% month-over-month drop and slid to rank 2, while Blue Rush Distillate Cartridge (0.8g) fell -43.1% and sat at rank 4. In contrast, Pineapple Cake Distillate Cartridge (0.8g) inched up +2.9% to hold rank 1, and Sour Diesel Distillate Cartridge (1g) declined -9.3% at rank 3. Three of the top four SKUs are Vapor Pens, concentrating share at the top ranks even as two of those pens declined more than -9% and the leading pen grew under +3%. The mix indicates One Orijin is leaning into Vapor Pens leadership despite volatility in secondary SKUs, suggesting focus on stabilizing non-flagship pens while rethinking the tincture strategy.
Top Selling Cannabis Brands






Data for this report comes from real-time sales reporting by participating cannabis retailers via their point-of-sale systems, which are linked up with Headset’s business intelligence software. Headset’s data is very reliable, as it comes digitally direct from our partner retailers. However, the potential does exist for misreporting in the instance of duplicates, incorrectly classified products, inaccurate entry of products into point-of-sale systems, or even simple human error at the point of purchase. Thus, there is a slight margin of error to consider. Brands listed on this page are ranked in the top twenty within the market and product category by total retail sales volume.

