May-2026
Sales
Trend
6-Month
Product Count
SKUs
Avg Price
YoY Sales Change
YoY Price Change
Market Insights Snapshot
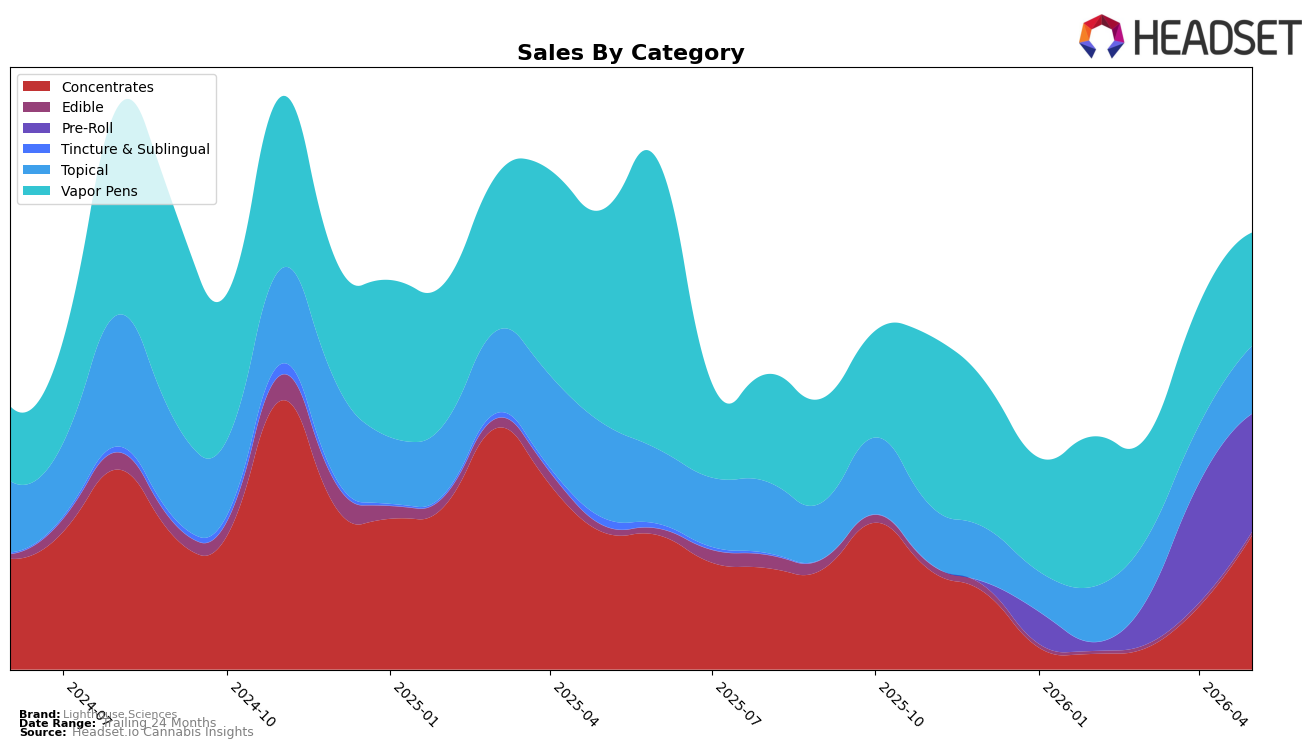
Lighthouse Sciences pivoted toward Concentrates in May 2026, lifting that segment to 30.74% share on 114.44% month-over-month growth despite a 2.25% year-over-year decline, while Vapor Pens fell to 25.96% share with a 6.65% MoM drop and a 47.31% YoY contraction. Pre-Roll held 27.02% share with a 1.30% MoM dip and no year-over-year read, and Topical rose 18.04% MoM to 15.51% share even as it was down 28.15% YoY; Edible remained marginal at 0.78% share with 1.29% MoM and 47.76% YoY declines. With average price down 8.37% YoY to $38.92 and brand sales down 5.13% YoY, the pattern implies Lighthouse Sciences is trading price for volume within Concentrates to offset sustained contractions in Vapor Pens and Edible.
The category rotation, combined with a rank of 9 in Concentrates in Ohio, implies Lighthouse Sciences is leaning into a defendable mid-pack position where price elasticity can recapture trips faster than in Vapor Pens, which is shedding demand at a 47.31% YoY rate. The sharper 114.44% MoM surge in Concentrates versus a 6.65% MoM decline in Vapor Pens and a 1.30% MoM dip in Pre-Roll suggests merchandising and supply allocation favored Concentrates, with Topical’s 18.04% MoM lift serving as a secondary hedge despite its 28.15% YoY drag; taken together, May 2026 signals a positioning strategy that concentrates assortment and promotional intensity where near-term share recovery is most responsive while de-emphasizing categories with steeper YoY erosion.
Competitive Landscape
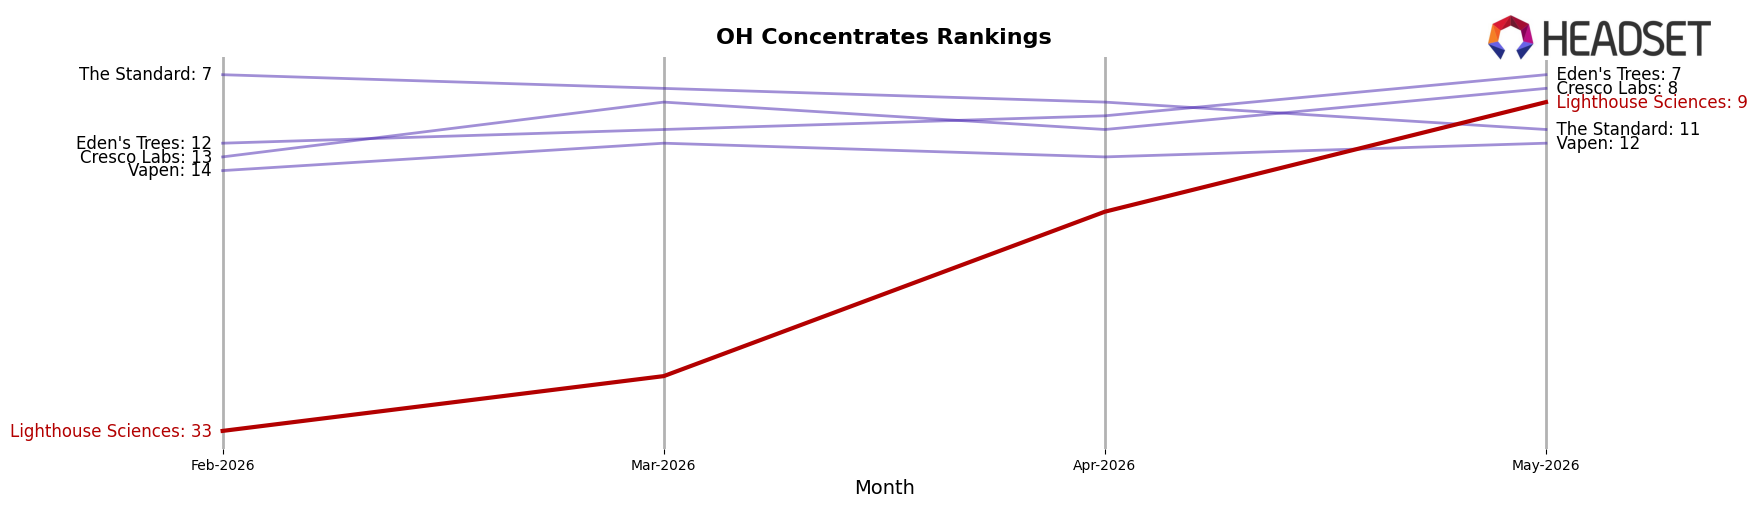
Lighthouse Sciences sits at rank #9 in OH Concentrates for May 2026, down 1 position from #8 year over year, while improving 24 spots from #33 in February 2026 to #9 in May 2026; against this, Klutch Cannabis held #1 with no rank change and Butterfly Effect - Grow Ohio moved up from #4 to #2 as its sales rose 58.97% year over year. Lighthouse Sciences peaked at #3 in November 2024 but now trails rivals as Hundred Percent Labs advanced from #6 to #4 with 99.55% YoY sales growth and Riviera Creek climbed from #7 to #5 with 86.12% YoY growth; the pattern implies Lighthouse Sciences is stabilizing mid-tier after a three-month rebound but ceding momentum to faster-rising competitors.
Notable Products
Forget Me Not Infused Pre-Roll 3-Pack (2.1g) posted the steepest decline in May 2026 at -28.8% MoM while sliding to rank 8, contrasting with CBD/THC 6:1 MJ Muscles & Joint Balm (1500mg CBD, 250mg THC, 1oz) up 14.5% MoM at rank 2. CBD/THC 6:1 MJ Muscles & Joint Balm (3000mg CBD, 500mg THC, 2oz) also advanced 24.3% MoM at rank 9, and Sweet Jamaican Skunk Double Diamonds Infused Pre-Roll 3-Pack (2.1g) climbed 38.3% MoM to rank 3. With two Topical SKUs in the top 10 and three Pre-Roll SKUs in the top 10, the mix points to Lighthouse Sciences leaning into wellness-led Topicals while trimming weaker Pre-Roll variants after the rank 8 contraction.
Top Selling Cannabis Brands
Data for this report comes from real-time sales reporting by participating cannabis retailers via their point-of-sale systems, which are linked up with Headset’s business intelligence software. Headset’s data is very reliable, as it comes digitally direct from our partner retailers. However, the potential does exist for misreporting in the instance of duplicates, incorrectly classified products, inaccurate entry of products into point-of-sale systems, or even simple human error at the point of purchase. Thus, there is a slight margin of error to consider. Brands listed on this page are ranked in the top twenty within the market and product category by total retail sales volume.

