Market Insights Snapshot
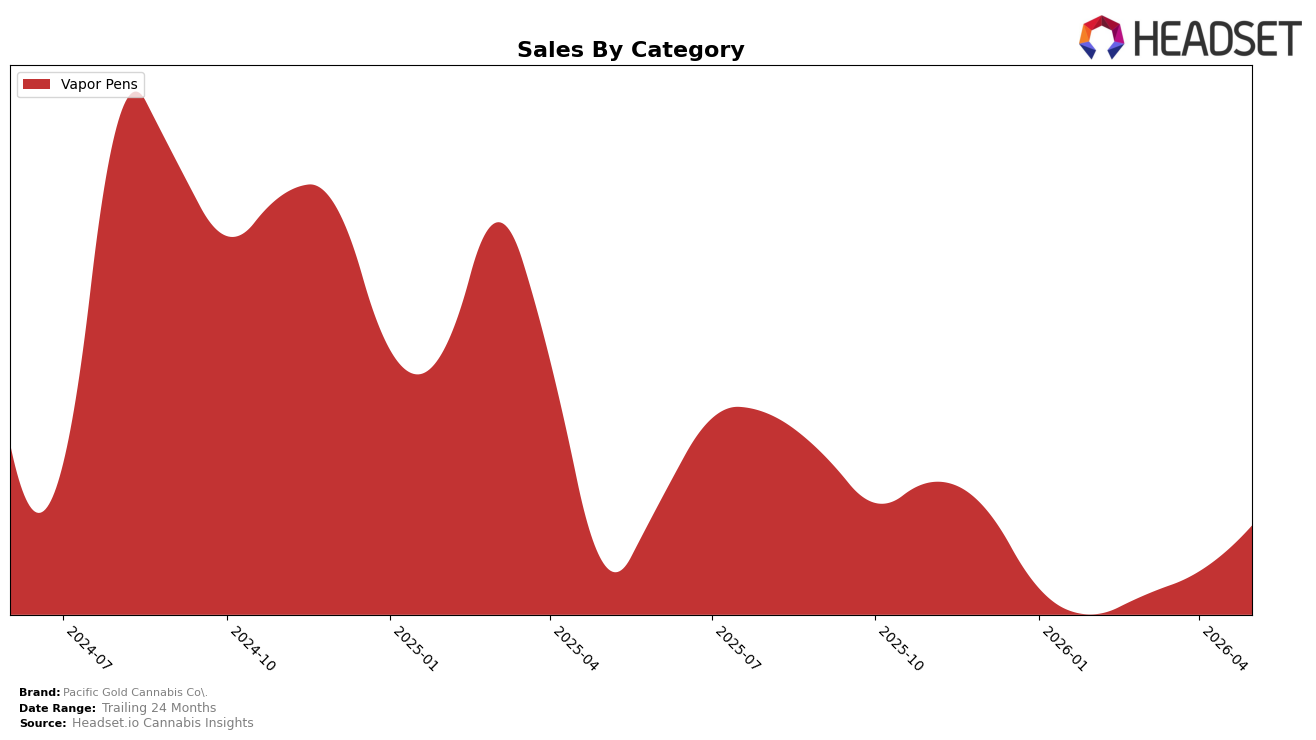
Pacific Gold Cannabis Co. concentrated entirely in Vapor Pens during May 2026, with Vapor Pens holding 100.0% of category mix and ranking 28th in Ohio for Vapor Pens. Year over year, Vapor Pens sales rose 15.37% while month over month they increased 19.42%, and the average price advanced 4.54% alongside a category share that remained at 100.0%. The combination of a 28th rank position and double‑digit MoM and YoY gains implies the growth is coming from depth within a single category rather than breadth, concentrating risk and opportunity in one lane.
The amplification of Vapor Pens to 100.0% share paired with a 19.42% MoM lift and a 15.37% YoY increase, while average price rose 4.54%, signals a move toward unit velocity at a slightly higher price point rather than diversification. Given a 28th rank in Ohio and a 24‑month brand sales change of −30.24%, the current trajectory points to a recovery strategy anchored in Vapor Pens outperformance versus prior periods, implying that sustained gains will depend on either climbing multiple rank positions within Vapor Pens or reintroducing secondary categories to mitigate single‑category exposure.
Competitive Landscape
Pacific Gold Cannabis Co. ranks #28 in OH Vapor Pens in May 2026, improving 5 positions from #33 year over year and 9 positions from #37 in February 2026, but remains 17 spots below its peak of #11 from May 2024; by contrast, Certified (Certified Cultivators) moved up from #2 to #1 while growing sales 51.9%, and Rove jumped from #12 to #4 on 106.5% YoY sales growth, indicating Pacific Gold Cannabis Co.’s rank gains are incremental relative to competitors capturing double-digit rank shifts and triple-digit growth, which implies a gradual recovery trajectory that is unlikely to close the competitive gap without a step-change in velocity.

Notable Products
Peach Ozz Distillate Disposable (1g) posted the largest month-over-month swing in May 2026 at +158.4%, jumping into a tie for rank 9 while Super Lemon Haze Distillate Disposable (1g) fell 44.7% to rank 6. Blueberry Distillate Disposable (1g) gained 52.4% to rank 2, while Pineapple Express Distillate Disposable (1g) rose 19.7% to hold rank 1 with $36,349 in sales. Nine of the top ten are Vapor Pens in the Disposable sub-set, and two flavors occupy ranks 1-2, which implies Pacific Gold Cannabis Co. is consolidating around disposable vapor SKUs and flavor-led winners rather than broadening into new categories.
Top Selling Cannabis Brands
Data for this report comes from real-time sales reporting by participating cannabis retailers via their point-of-sale systems, which are linked up with Headset’s business intelligence software. Headset’s data is very reliable, as it comes digitally direct from our partner retailers. However, the potential does exist for misreporting in the instance of duplicates, incorrectly classified products, inaccurate entry of products into point-of-sale systems, or even simple human error at the point of purchase. Thus, there is a slight margin of error to consider. Brands listed on this page are ranked in the top twenty within the market and product category by total retail sales volume.

