.svg)

Sep-2026
Sales
Trend
6-Month
Product Count
SKUs
Avg Price
YoY Sales Change
YoY Price Change


Where to Buy
Fire Dept. Cannabis is stocked at 120 licensed dispensaries across Oregon, with the deepest coverage in Portland, Salem, Bend, Eugene, and Ontario. Search by ZIP code or city below to find the closest one, or filter by product type if you are after a specific format.
Market Insights Snapshot
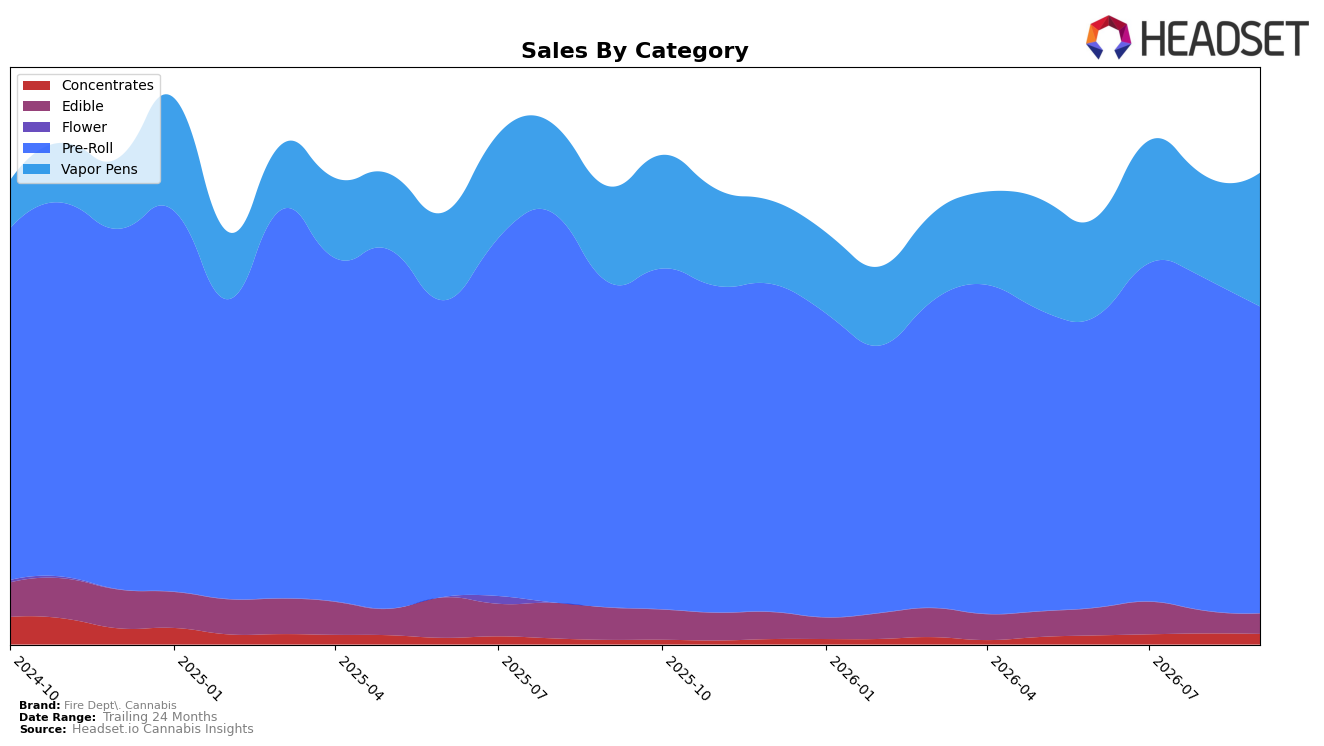
Fire Dept. Cannabis concentrated 65.17% of September 2026 sales in Pre-Roll, down 5.68% year over year and 7.74% month over month, while Vapor Pens rose to 28.37% share with sales up 39.49% YoY and 30.54% MoM. Edible contracted to 4.27% share with a 37.09% YoY decline and a 9.71% MoM drop, as Concentrates held 2.19% share with a 137.36% YoY surge but a 4.26% MoM dip. The brand’s average price rose 5.30% YoY to $9.86, and within its core, Fire Dept. Cannabis held rank 5 in Pre-Roll in Oregon; the pattern implies a pivot from an eroding Pre-Roll base toward faster-growing inhalables, with price leverage cushioning mix volatility.
With Pre-Roll share at 65.17% but declining 7.74% MoM alongside a 30.54% MoM lift in Vapor Pens to 28.37% share, the portfolio is re-weighting toward higher-ticket inhalables, supported by a 39.49% YoY gain in Vapor Pens versus a 5.68% YoY decline in Pre-Roll. The 137.36% YoY rise in Concentrates against a 4.26% MoM slip, paired with a 37.09% YoY drop in Edible, indicates the brand’s demand is consolidating around fast-cycling, potency-forward formats; the implication is that maintaining rank 5 in Oregon Pre-Roll will require defending core SKUs while using Vapor Pens’ momentum to offset near-term share erosion.
Competitive Landscape
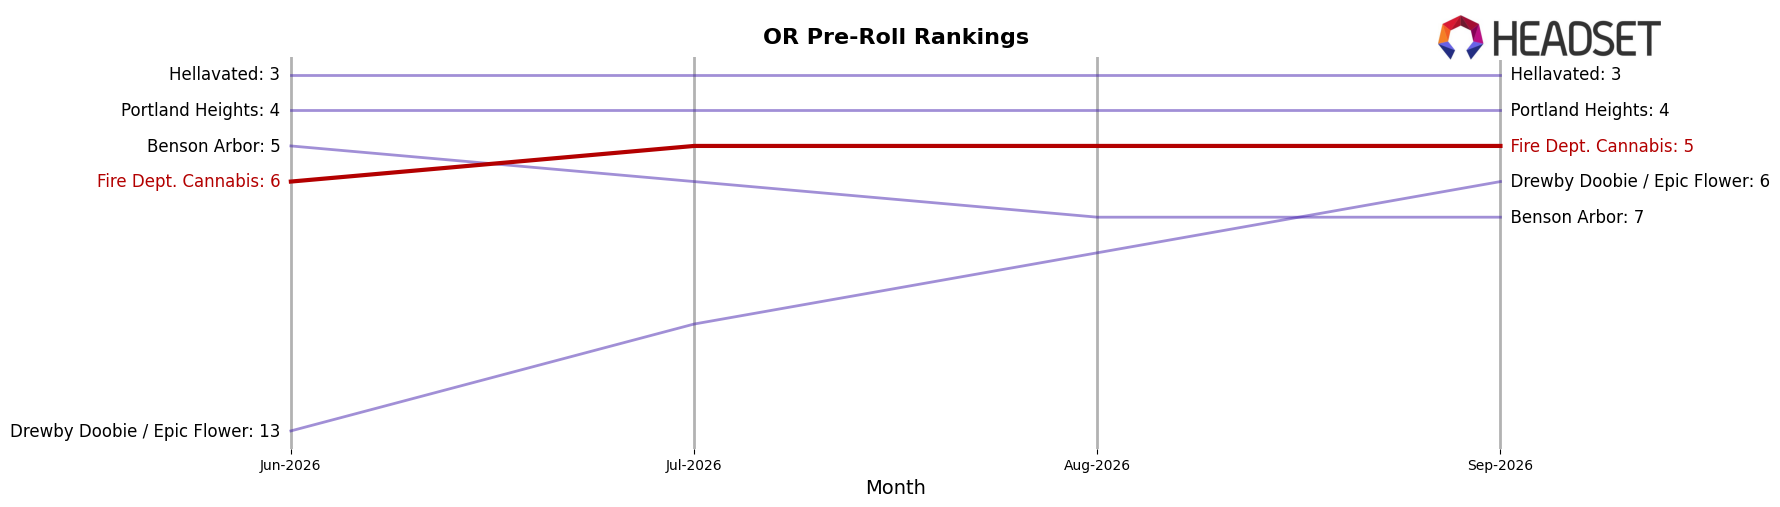
Fire Dept. Cannabis sits at rank #5 in OR Pre-Roll for September 2026, improving 2 positions from #7 year over year and up 1 spot from #6 in June 2026, while still 2 places below its peak rank of #3 from March 2025. In contrast, STiCKS held rank #1 with no YoY rank change and expanded sales by 91.7%, and Kaprikorn climbed from #6 to #2 with 160.0% YoY sales growth, whereas Hellavated slipped from #2 to #3 with a 27.1% YoY sales decline. With Fire Dept. Cannabis advancing 2 ranks YoY yet lagging its March 2025 peak by 2 spots, the trajectory implies steady share defense but not enough acceleration to challenge the #1–#2 tier without a step-change in velocity.
Notable Products
Supernova Pre-Roll (0.5g) posted the steepest decline at -22.6% and slid to rank 7, while Ponderosa Pine Pre-Roll (0.5g) fell -8.3% to rank 2, setting a divergent tone within the lineup. Kyber Crystal Pre-Roll (0.5g) advanced +31.2% to rank 3, but no SKU exceeded a +50% surge, indicating momentum is mixed rather than breakout. The pattern implies Fire Dept. Cannabis is reallocating velocity within existing pre-roll SKUs rather than unlocking new step-change growth in September 2026.
Eight of the top ten are Pre-Roll SKUs, concentrating share despite Maui Wowie Live Diamond Disposable (1g) holding rank 5 with $28,003 in sales. Helmz Deep Pre-Roll (0.5g) held rank 1 with no reported MoM rate, while Bubble Bath Pre-Roll 10-Pack (5g) sat at rank 10 without a published change, reinforcing category depth but uneven week-to-week gains. This concentration implies a portfolio anchored in Pre-Roll breadth with selective bets in Vapor Pens to hedge demand shifts.
Top Selling Cannabis Brands






Data for this report comes from real-time sales reporting by participating cannabis retailers via their point-of-sale systems, which are linked up with Headset’s business intelligence software. Headset’s data is very reliable, as it comes digitally direct from our partner retailers. However, the potential does exist for misreporting in the instance of duplicates, incorrectly classified products, inaccurate entry of products into point-of-sale systems, or even simple human error at the point of purchase. Thus, there is a slight margin of error to consider. Brands listed on this page are ranked in the top twenty within the market and product category by total retail sales volume.

