Jun-2026
Sales
Trend
6-Month
Product Count
SKUs
Avg Price
YoY Sales Change
YoY Price Change
Market Insights Snapshot
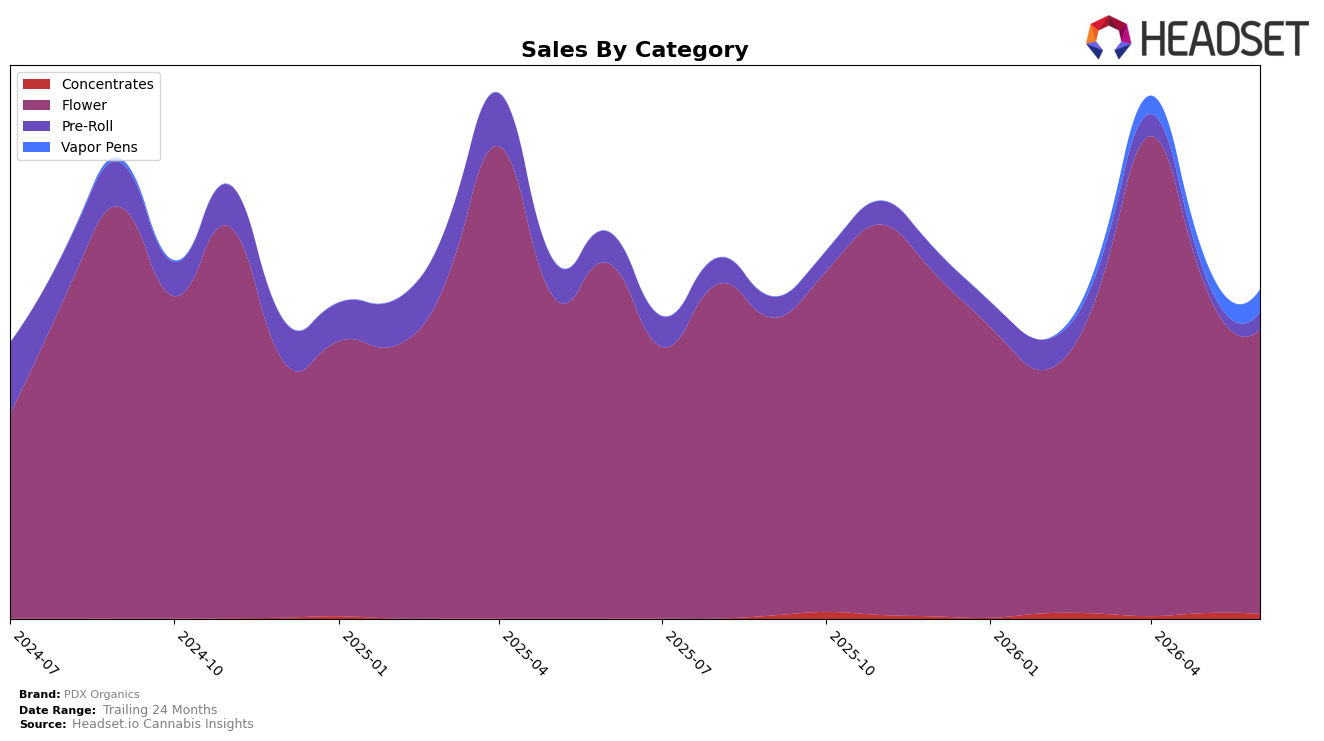
In June 2026, PDX Organics concentrated 86.59% of sales in Flower while Vapor Pens and Pre-Roll held 6.90% and 5.08% share, respectively, indicating a narrow category mix despite a 22.24% two-year lift paired with a -15.06% year-over-year decline. Flower contracted -19.99% YoY and -13.32% MoM as average price slipped -2.91% YoY to $13.87, while Pre-Roll fell -46.61% YoY even as it jumped 49.15% MoM; the offset came from Vapor Pens, which rose 42.87% MoM despite no YoY baseline, and Concentrates, at 1.43% share, declined -15.05% MoM with no YoY. With Oregon Flower rank at 18 and Flower still the top category, the pattern implies dependency risk in a weakening core while short-cycle gains in Vapor Pens and Pre-Roll are not yet large enough to counter sustained Flower drag.
The combination of a -19.99% YoY drop in Flower and a -46.61% YoY decline in Pre-Roll, alongside MoM rebounds of 49.15% in Pre-Roll and 42.87% in Vapor Pens, implies PDX Organics is migrating demand toward faster-turn subcategories but from a small base that leaves overall exposure to Flower volatility intact. Holding an Oregon Flower rank of 18 while Flower retains 86.59% share suggests that near-term share defense depends more on stabilizing Flower than on incremental gains in categories under 7% share, implying that pricing and assortment shifts in Flower need to outpace the -13.32% MoM contraction for the category mix to materially de-risk.
Competitive Landscape
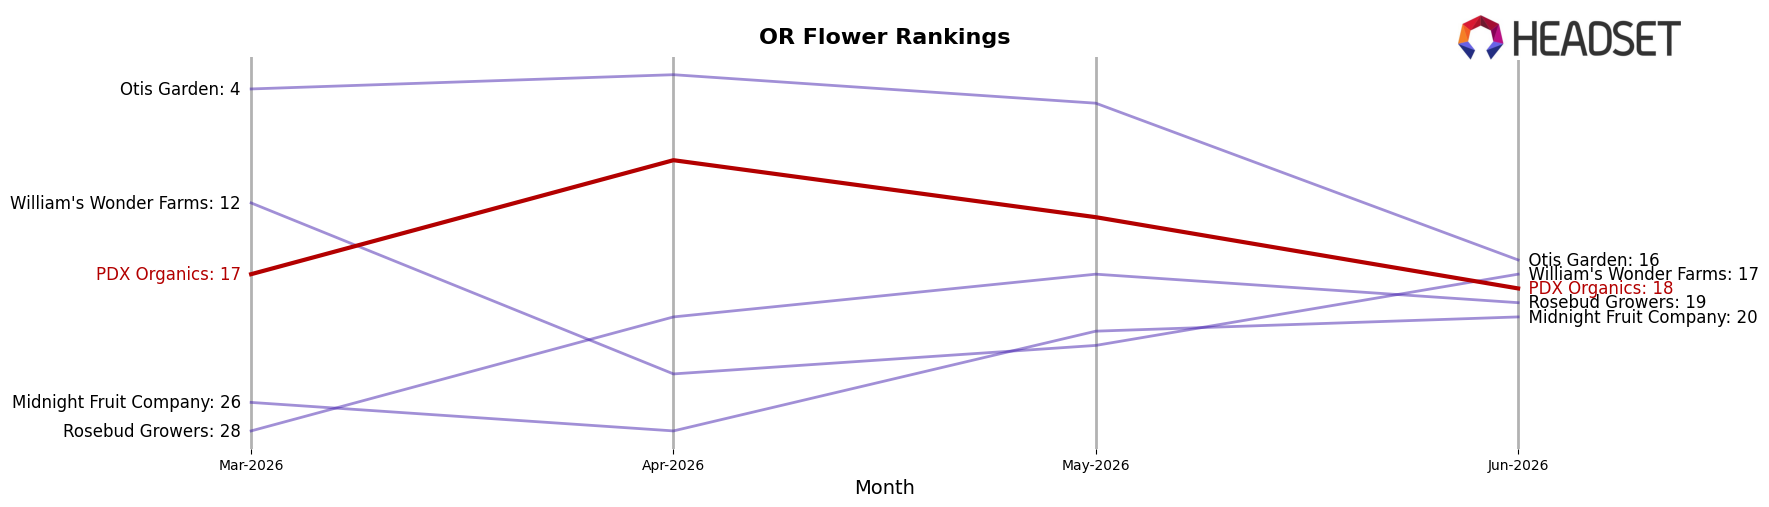
PDX Organics sits at rank 18 in OR Flower for June 2026, down 3 positions from rank 15 year over year, and also 1 position lower than March 2026’s rank 17; despite a peak at rank 9 in April 2026, the brand has not sustained a top-10 slot. In contrast, Grown Rogue climbed from rank 6 to rank 2 alongside a 123.97% YoY sales increase, while PRUF Cultivar / PRŪF Cultivar held rank 1 year over year with an 18.71% YoY sales gain; meanwhile, Bald Peak stayed at rank 3 with a -5.61% YoY change, indicating that upward mobility is possible even amid mixed competitor growth. The pattern—peaking at rank 9 in April 2026 but sliding to rank 18 by June 2026—implies PDX Organics is losing share to faster-rising peers and needs month-over-month retention moves to arrest rank erosion.
Notable Products
Trop Cherry Gas (Bulk) posted the steepest decline in June 2026 at -64.2% MoM, sliding to rank 5, while Scissor Queen (28g) surged +206.0% MoM to rank 1, indicating sharp intra-portfolio rotation rather than broad demand expansion. Candy Flip (Bulk) also jumped +109.5% MoM to rank 3, and Platinum Candy Mintz #6 (Bulk) rose +57.0% MoM to rank 4, while Grape Tang (Bulk) held rank 2 without a reported MoM rate, signaling momentum concentrated in just a few Flower SKUs. With eight of the top ten products in the Flower category and only one Pre-Roll appearance at rank 6, the mix implies PDX Organics is leaning into higher-velocity Flower offerings while tolerating volatility among lower-ranked batches.
Top Selling Cannabis Brands
Data for this report comes from real-time sales reporting by participating cannabis retailers via their point-of-sale systems, which are linked up with Headset’s business intelligence software. Headset’s data is very reliable, as it comes digitally direct from our partner retailers. However, the potential does exist for misreporting in the instance of duplicates, incorrectly classified products, inaccurate entry of products into point-of-sale systems, or even simple human error at the point of purchase. Thus, there is a slight margin of error to consider. Brands listed on this page are ranked in the top twenty within the market and product category by total retail sales volume.

