Nov-2025
Sales
Trend
6-Month
Product Count
SKUs
Avg Price
YoY Sales Change
YoY Price Change
Market Insights Snapshot

In the state of Oregon, The Heights Co. has shown fluctuating performance across different product categories. Specifically, in the Flower category, they maintained a strong presence in the top 10 rankings from August to October 2025, even climbing to the 6th position in October. However, by November, there was a notable drop to the 24th position, indicating a significant decline in their standing. This movement suggests potential challenges or increased competition in the market. On the other hand, their performance in the Concentrates category did not place them in the top 30 rankings for any of the months from August to November, which could be seen as a concerning trend for their market presence in this segment.
The sales trends for The Heights Co. further illustrate these dynamics. In the Flower category, despite the drop in ranking by November, there was a noticeable peak in sales in October, which might have been driven by specific marketing efforts or seasonal demand. Conversely, the Concentrates category saw a steady decline in sales from August through November, further emphasizing the brand's struggle to capture significant market share in this segment. This consistent decrease in sales, coupled with the absence from the top rankings, highlights the need for strategic adjustments in their Concentrates offerings or marketing approach in Oregon.
Competitive Landscape
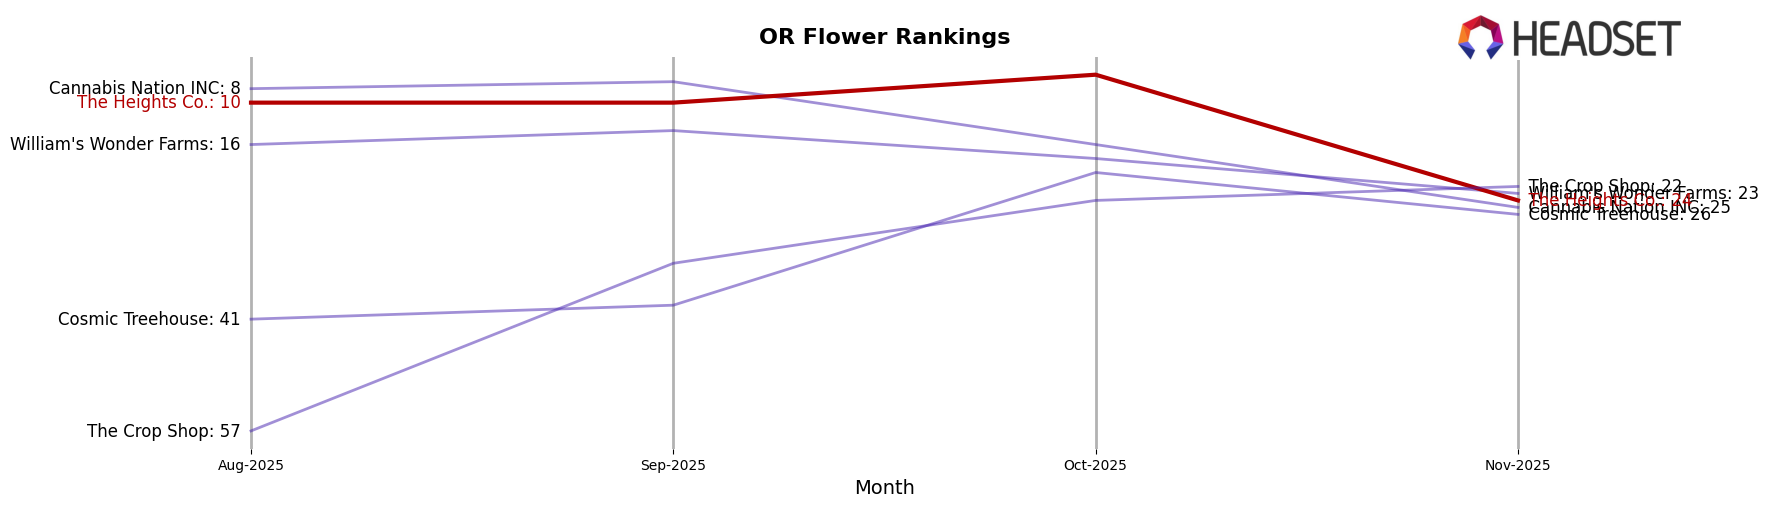
In the Oregon flower category, The Heights Co. experienced a notable fluctuation in its market position from August to November 2025. Starting at a stable rank of 10th in both August and September, The Heights Co. climbed to 6th place in October, indicating a significant boost in market presence and potentially capturing consumer interest. However, by November, the brand saw a sharp decline, dropping to 24th place, suggesting increased competition and possible challenges in maintaining its earlier momentum. This decline is particularly striking when compared to competitors such as Cannabis Nation INC, which also experienced a drop from 8th to 25th place over the same period, and William's Wonder Farms, which fell out of the top 20 by November. Meanwhile, The Crop Shop improved its rank from 57th in August to 22nd in November, showcasing a positive growth trajectory. These shifts highlight the dynamic nature of the Oregon flower market, where The Heights Co. faces both opportunities and challenges in sustaining its competitive edge.
Notable Products
In November 2025, The Heights Co. saw Fatso (Bulk) in the Flower category climb to the top position, up from its previous third-place rank in October. This product achieved a notable sales figure of 2132 units, marking it as the best performer for the month. Ridgeline Lantz (3.5g) made a strong debut, securing the second rank without any prior ranking in the dataset. Blue Nerdz (Bulk) maintained a consistent presence, holding the third position, although its sales dipped slightly from the previous month. Animal Tsunami (1g) dropped from second to fourth place, indicating a shift in consumer preference within the Flower category.
Top Selling Cannabis Brands
Data for this report comes from real-time sales reporting by participating cannabis retailers via their point-of-sale systems, which are linked up with Headset’s business intelligence software. Headset’s data is very reliable, as it comes digitally direct from our partner retailers. However, the potential does exist for misreporting in the instance of duplicates, incorrectly classified products, inaccurate entry of products into point-of-sale systems, or even simple human error at the point of purchase. Thus, there is a slight margin of error to consider. Brands listed on this page are ranked in the top twenty within the market and product category by total retail sales volume.

