.svg)

Sep-2026
Sales
Trend
6-Month
Product Count
SKUs
Avg Price
YoY Sales Change
YoY Price Change


Where to Buy
Perpetual Harvest is stocked at 134 licensed dispensaries across Massachusetts, with the deepest coverage in Boston, Worcester, Brockton, Fall River, and Cambridge. Search by ZIP code or city below to find the closest one, or filter by product type if you are after a specific format.
Market Insights Snapshot
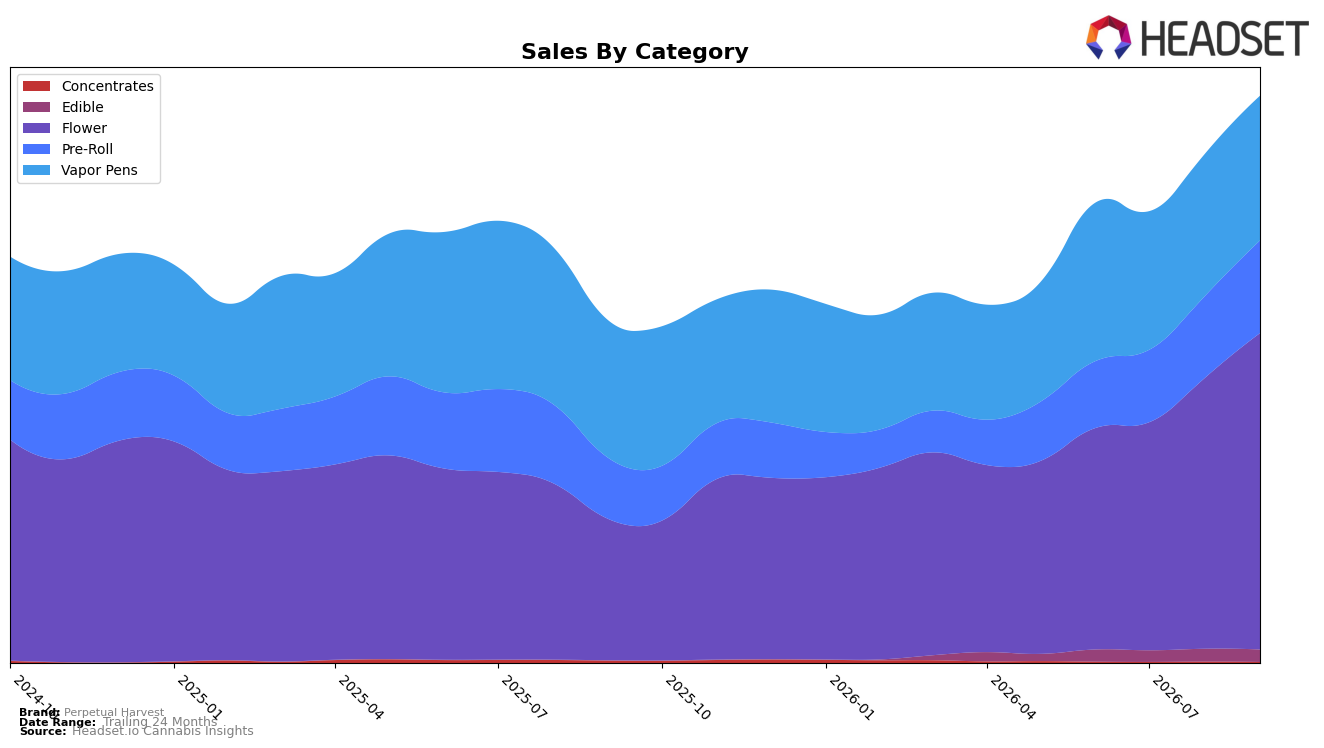
In September 2026, Perpetual Harvest concentrated over half of sales in Flower at 55.85% share with year-over-year growth of 124.12% and month-over-month growth of 16.91%, while Vapor Pens held 25.52% share with 5.20% YoY and 1.76% MoM. Pre-Roll contributed 16.32% share with 52.04% YoY and 13.37% MoM, and Edible, though only 2.15% share, expanded 16829.91% YoY despite a -3.08% MoM dip; Concentrates fell to 0.16% share with -59.16% YoY and -26.91% MoM. With Flower ranked 1 in Massachusetts and the brand’s average price down 10.07% YoY to $15.16, the mix indicates a deliberate tilt toward high-velocity inhalables (Flower and Pre-Roll) while de-emphasizing Concentrates.
The mix shifts imply Perpetual Harvest is prioritizing accessible price points and volume categories: Flower’s 124.12% YoY alongside a 10.07% YoY price decline signals price-elastic demand capture, and Pre-Roll’s 13.37% MoM gains reinforce convenience-driven trial that complements Vapor Pens’ steadier 1.76% MoM. The 16829.91% YoY spike in Edible from a 2.15% base, contrasted with Concentrates’ -26.91% MoM contraction, suggests selective expansion into incremental occasions while exiting or rationalizing niche potency segments. Net effect: the brand is anchoring category leadership in Flower (rank 1 in Massachusetts) and using lower price points to broaden reach, with Pre-Roll as the secondary growth lever and Edible as a test-and-scale option rather than a core pillar.
Competitive Landscape
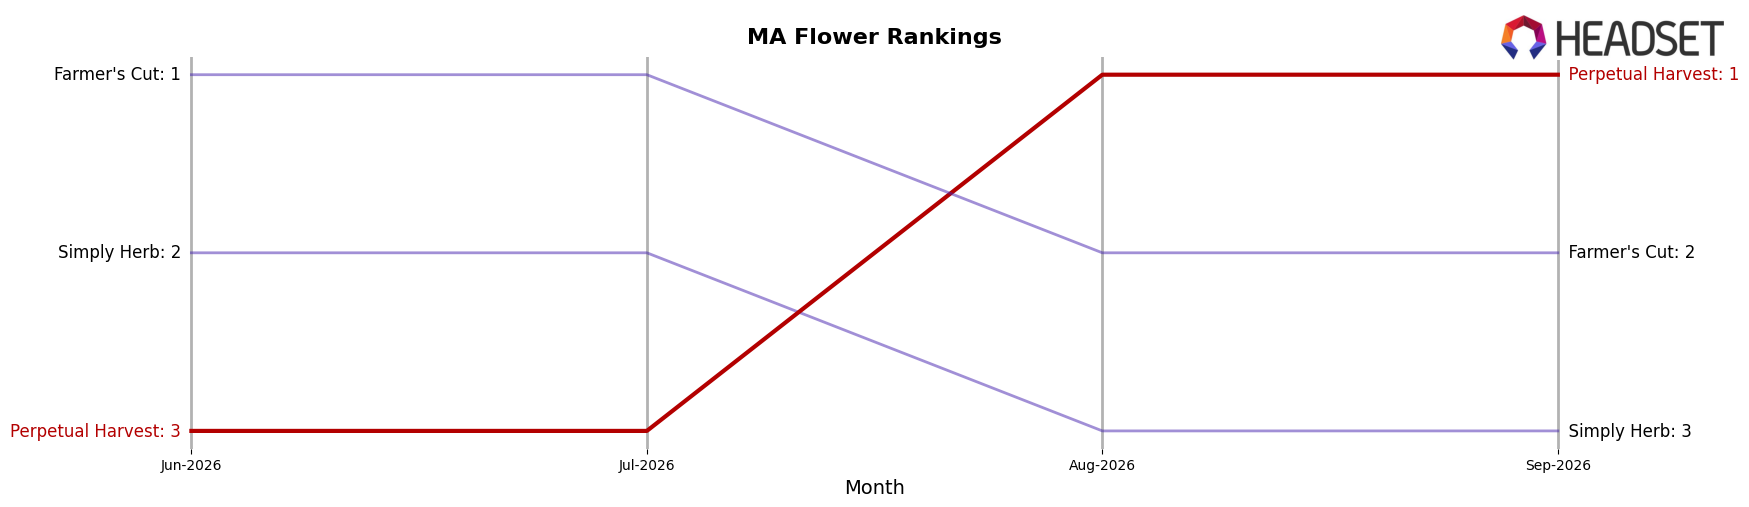
Perpetual Harvest sits at rank #1 in MA Flower in September 2026 after a YoY climb of 3 positions from #4, and it also improved 2 positions from #3 three months ago to reach its peak in September 2026; meanwhile, Farmer's Cut holds #2 with a +37.5% YoY sales change but did not gain rank YoY, and Simply Herb slid from #1 YoY to #3 with a −16.6% YoY sales change, indicating that Perpetual Harvest’s ascent to #1 amid a competitor declining 2 ranks and another stagnating in rank suggests a durable share capture rather than a temporary spike.
Notable Products
Chocolope Pre-Roll (1g) delivered the standout move with a 147.7% month-over-month surge to rank 1, while Acapulco Gold Distillate Cartridge (1g) advanced at a more modest 19.9% to rank 8. Northern Lights Distillate Cartridge (1g) inched up 2.2% to rank 9, placing both vapor SKUs below a pre-roll that now leads the lineup. With seven of the top ten SKUs in September 2026 coming from the Pre-Roll category and the lead item more than doubling, the mix points to Perpetual Harvest leaning into pre-roll velocity over incremental vape gains.
Top Selling Cannabis Brands






Data for this report comes from real-time sales reporting by participating cannabis retailers via their point-of-sale systems, which are linked up with Headset’s business intelligence software. Headset’s data is very reliable, as it comes digitally direct from our partner retailers. However, the potential does exist for misreporting in the instance of duplicates, incorrectly classified products, inaccurate entry of products into point-of-sale systems, or even simple human error at the point of purchase. Thus, there is a slight margin of error to consider. Brands listed on this page are ranked in the top twenty within the market and product category by total retail sales volume.

