.svg)

Sep-2026
Sales
Trend
6-Month
Product Count
SKUs
Avg Price
YoY Sales Change
YoY Price Change


Where to Buy
Farmer's Cut is stocked at 115 licensed dispensaries across Massachusetts, with the deepest coverage in Boston, Cambridge, Framingham, Pittsfield, and Holyoke. Search by ZIP code or city below to find the closest one, or filter by product type if you are after a specific format.
Market Insights Snapshot
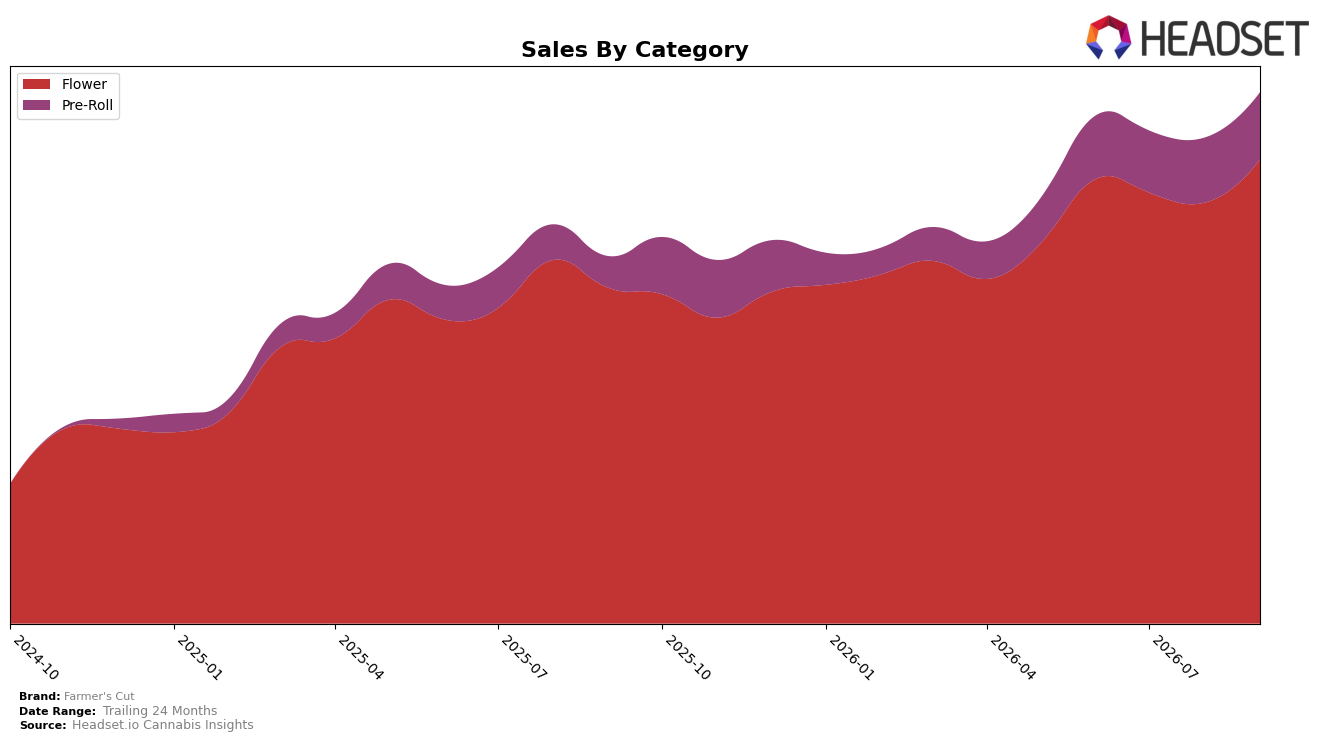
In September 2026, Farmer's Cut concentrated 86.53% of sales in Flower while Pre-Roll held 13.47%, with Flower up 37.50% year over year and 10.09% month over month, versus Pre-Roll up 95.34% year over year and 3.11% month over month. Despite average price declining 13.72% year over year to $17.18, brand sales grew 43.21% year over year and 207.96% over 24 months, indicating mix and volume gains outpaced price compression. With Flower ranked 2 in Massachusetts and Pre-Roll expanding faster year over year than month over month, the pattern implies Farmer's Cut leaned on Flower for near-term momentum while cultivating a secondary Pre-Roll growth lane that is accelerating contribution without diluting the Flower position.
The steeper 95.34% year-over-year lift in Pre-Roll against a 37.50% lift in Flower, combined with Flower’s 10.09% month-over-month versus Pre-Roll’s 3.11% month-over-month, suggests Farmer's Cut is transitioning from a single-category engine to a dual-track portfolio where Flower drives baseline rank and Pre-Roll builds incremental reach. Holding a rank of 2 in Massachusetts Flower while average price fell 13.72% year over year, alongside an 86.53% share mix in Flower, implies pricing flexibility is being used to protect rank and throughput in the lead category as Pre-Roll’s faster year-over-year growth broadens entry points; this positioning favors sustained volume capture now with optionality to rebalance mix if Flower’s month-over-month edge narrows.
Competitive Landscape
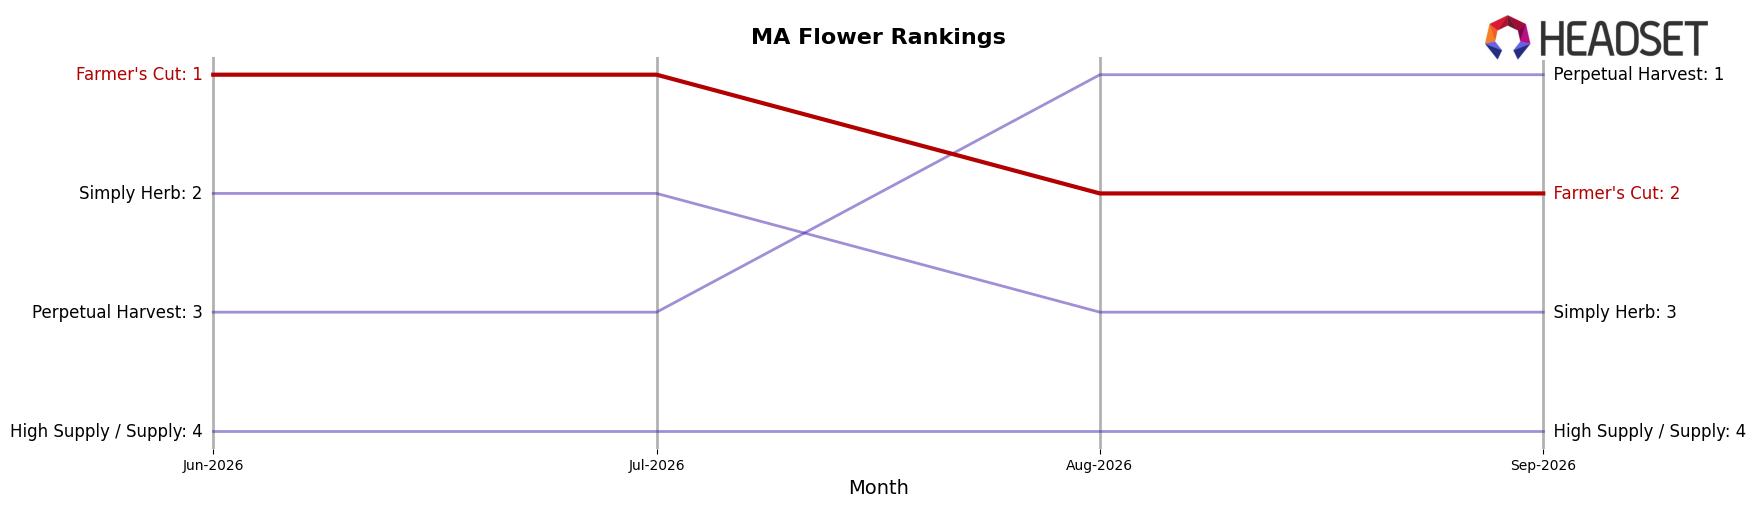
Farmer's Cut sits at rank #2 in MA Flower in September 2026, unchanged year over year at #2 but down from #1 three months ago, while its peak at #1 came in July 2026; meanwhile, Perpetual Harvest moved from #4 year over year to #1 with 124.1% YoY sales growth, and Simply Herb slid from #1 year over year to #3 with a 16.6% YoY sales decline, indicating Farmer's Cut has maintained a top-two position but ceded recent momentum to a faster-rising leader, implying the brand’s trajectory is stable in share hierarchy yet vulnerable to continued displacement if it does not reaccelerate.
Notable Products
Cheddar Cheeze Pre-Roll (1g) posted the standout move in September 2026 with a +69.4% month-over-month surge and a jump to rank 1, while Kabuki Sour (3.5g) slipped by -3.2% and sat at rank 7. Two of the top five are Pre-Roll SKUs and four of the top ten are Flower SKUs, indicating a split demand profile anchored by a pre-roll breakout at the top and depth in Flower through Northern Lime Lights (3.5g) at rank 3 with +24.2% MoM. The August-to-September mix shift implies Farmer's Cut is leaning into pre-roll velocity to capture share at the peak of the ranking while Flower sustains the volume base, with the $115,195 Strawberries Bubble Yum (3.5g) at rank 2 reinforcing that balance.
Top Selling Cannabis Brands






Data for this report comes from real-time sales reporting by participating cannabis retailers via their point-of-sale systems, which are linked up with Headset’s business intelligence software. Headset’s data is very reliable, as it comes digitally direct from our partner retailers. However, the potential does exist for misreporting in the instance of duplicates, incorrectly classified products, inaccurate entry of products into point-of-sale systems, or even simple human error at the point of purchase. Thus, there is a slight margin of error to consider. Brands listed on this page are ranked in the top twenty within the market and product category by total retail sales volume.

