May-2026
Sales
Trend
6-Month
Product Count
SKUs
Avg Price
YoY Sales Change
YoY Price Change
Market Insights Snapshot
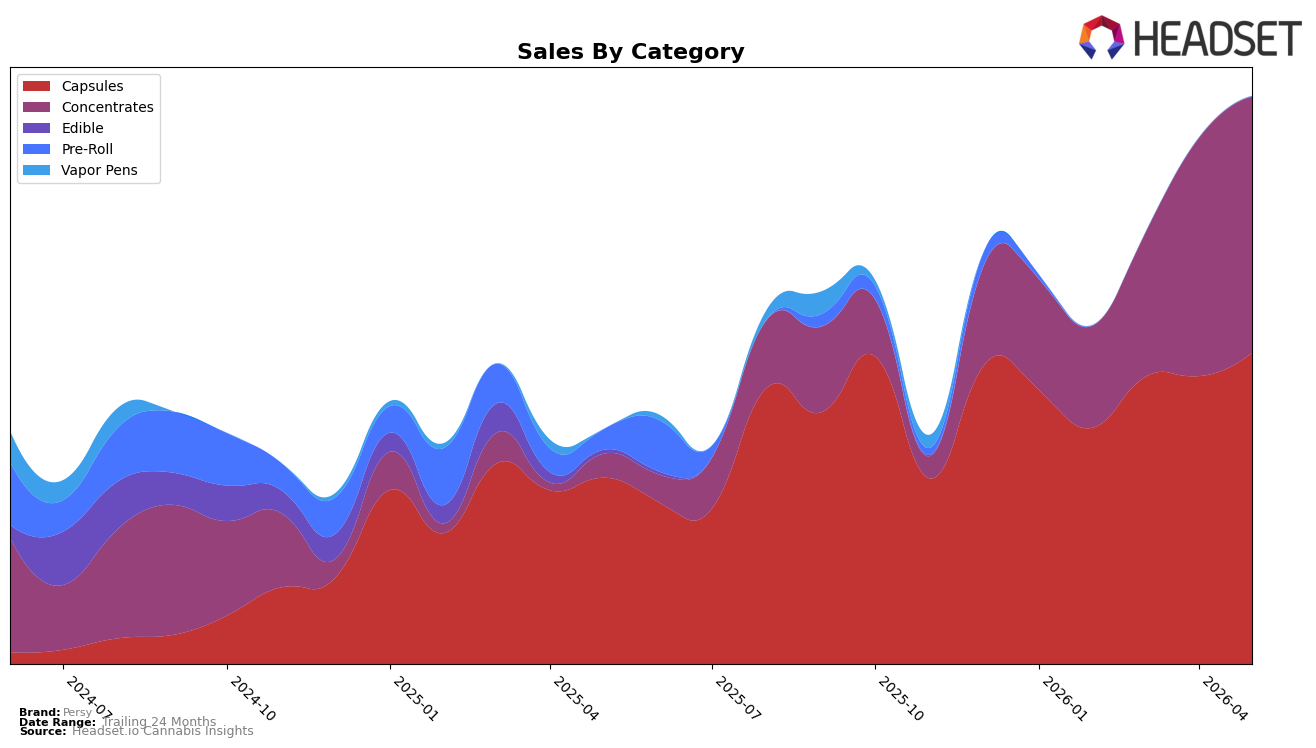
In May 2026, Persy’s category mix was split between Capsules at 54.87% share and Concentrates at 45.13% share, with Capsules growing 67.04% year over year and 8.08% month over month while Concentrates surged 983.23% year over year and 7.74% month over month. The average brand price rose 37.64% year over year to $36.36, with category-level pricing spread from $26.83 in Capsules to $64.05 in Concentrates, implying a mix shift toward higher-ticket units alongside a still-majority share in Capsules. The pattern suggests Persy’s revenue expansion is leaning on a rapidly scaling Concentrates contribution without displacing the Capsules base, which positions the brand to compound growth through dual-track volume in Capsules and yield in Concentrates.
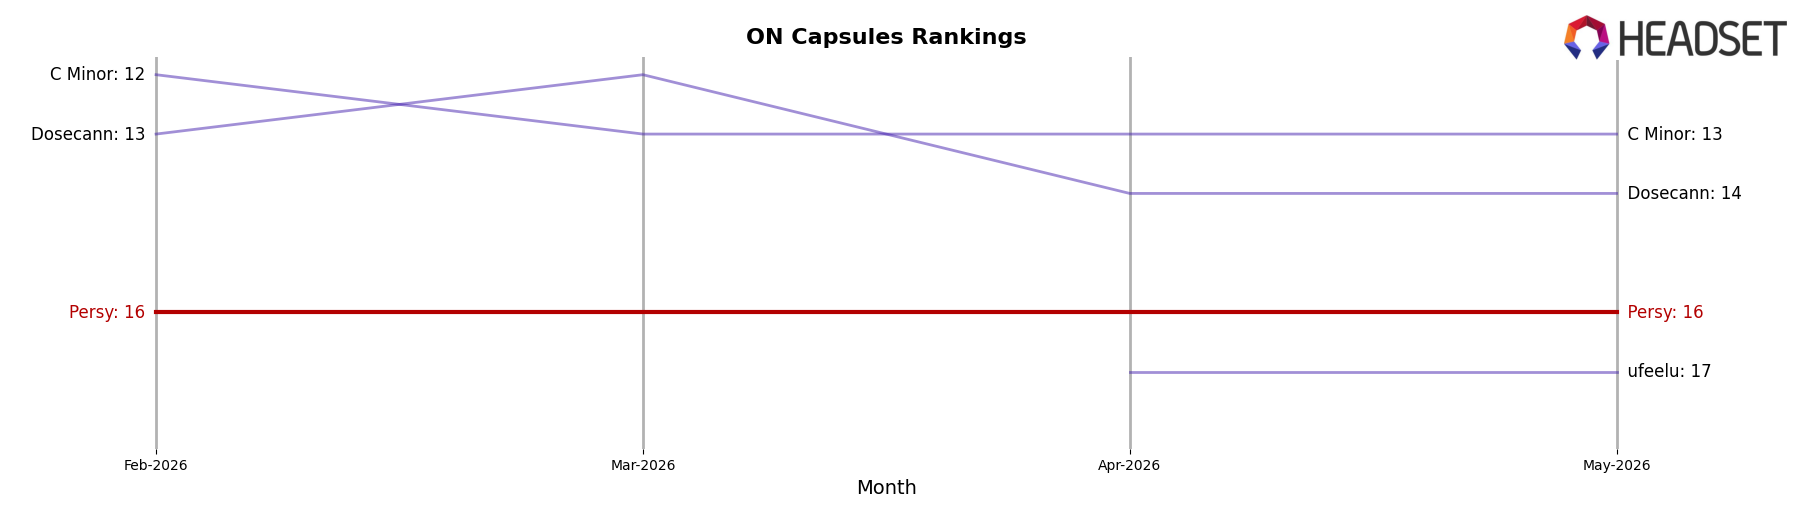
Persy held rank 16 in Capsules in Ontario while Capsules retained a 54.87% sales share and Concentrates captured 45.13%, indicating the brand’s current market position is anchored in Capsules even as Concentrates deliver outsized year-over-year momentum of 983.23% versus 67.04% in Capsules. With both categories advancing month over month—8.08% for Capsules and 7.74% for Concentrates—the mix points to a balanced near-term trajectory: Capsules support rank stability in Ontario while Concentrates’ higher average price at $64.05 elevates revenue density relative to the $26.83 Capsules price point. The implication is that Persy’s positioning can migrate from a single-category anchor toward a premium-skewed, two-pillar portfolio, using Capsules scale to preserve distribution and Concentrates pricing to lift overall revenue efficiency.
Competitive Landscape
Persy is currently ranked #16 in ON Capsules, improving 6 positions from #22 year over year, while holding flat versus three months ago at #16, and reaching its peak rank of #16 in May 2026; this places Persy behind Aspire at #1 (steady from #1 with +20.6% YoY sales) and Glacial Gold, which rose from #4 to #2 with +39.1% YoY sales, but ahead in momentum versus Tweed, which fell from #2 to #5 with a -47.4% YoY sales decline; taken together, a 6-rank YoY climb paired with a plateau at #16 implies Persy has moved into the mid-tier but needs a step-change to break past a ceiling occupied by faster risers.
Notable Products
Lot420 X Full Spectrum Cold Cured Live Rosin Batter (1g) posted the steepest movement with a -50.0% month-over-month drop and fell to rank 3, while Full Spectrum Cold Cured Live Rosin Batter (1g) climbed 37.4% MoM to rank 2. Strain Specific Full Spectrum Live Rosin Capsules 30-Pack (300mg) held rank 1 with an 8.1% MoM lift, and Concentrates occupied two of the top three positions. The pattern implies substitution inside Concentrates toward the house Batter SKU as the collaboration SKU contracts, concentrating demand in fewer winners.
Top Selling Cannabis Brands
Data for this report comes from real-time sales reporting by participating cannabis retailers via their point-of-sale systems, which are linked up with Headset’s business intelligence software. Headset’s data is very reliable, as it comes digitally direct from our partner retailers. However, the potential does exist for misreporting in the instance of duplicates, incorrectly classified products, inaccurate entry of products into point-of-sale systems, or even simple human error at the point of purchase. Thus, there is a slight margin of error to consider. Brands listed on this page are ranked in the top twenty within the market and product category by total retail sales volume.

