Jun-2026
Sales
Trend
6-Month
Product Count
SKUs
Avg Price
YoY Sales Change
YoY Price Change
Market Insights Snapshot
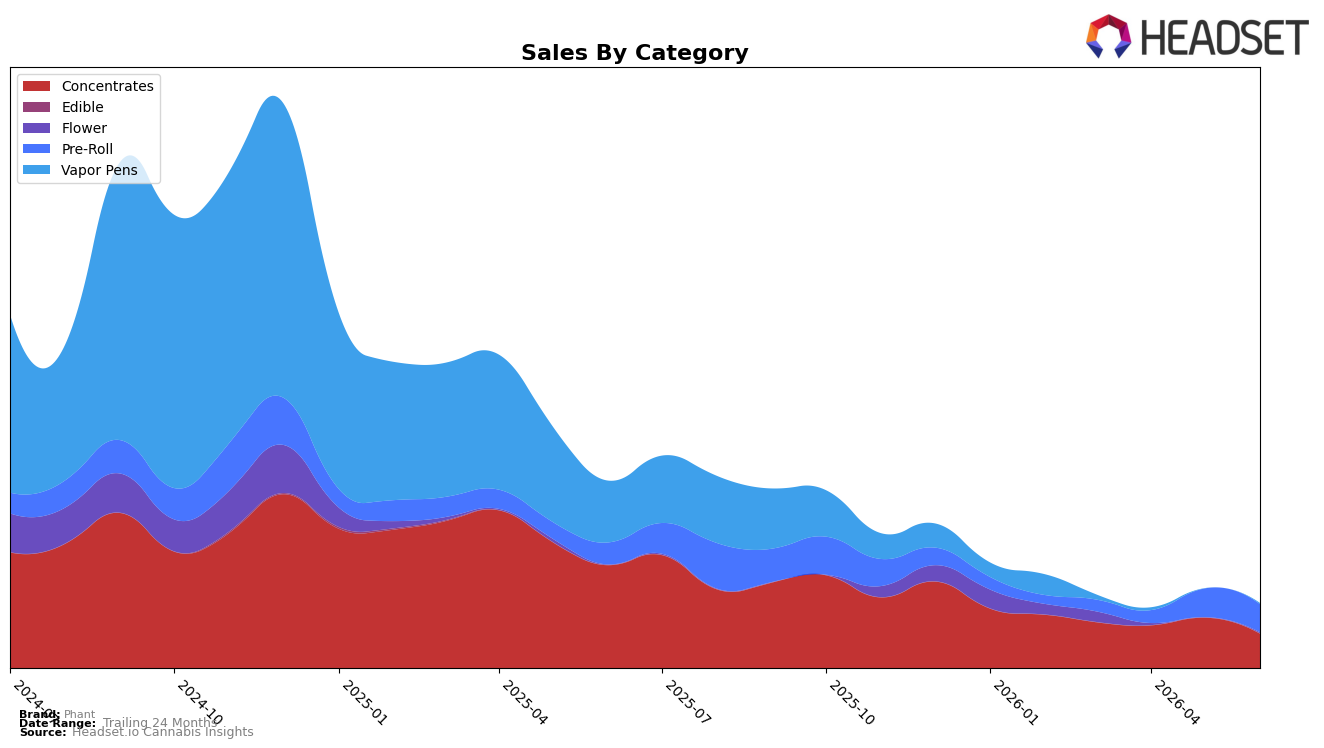
In June 2026, Phant concentrated 53.55% of sales in Concentrates with a year-over-year decline of 66.75% and a month-over-month drop of 31.89%, while Pre-Roll accounted for 43.78% with a 28.75% year-over-year increase and a 1.86% month-over-month dip. Minor categories moved unevenly: Vapor Pens fell 98.52% year over year to 1.43% share, and Flower grew 271.93% year over year to 1.24% share, signaling a barbell mix between Concentrates and Pre-Roll. With an average price down 55.54% year over year to $13.67 and Pre-Roll now near parity with Concentrates in share, the thesis is that Phant is reallocating demand toward lower-priced, faster-turning formats to stabilize volume amid a shrinking Concentrates base.
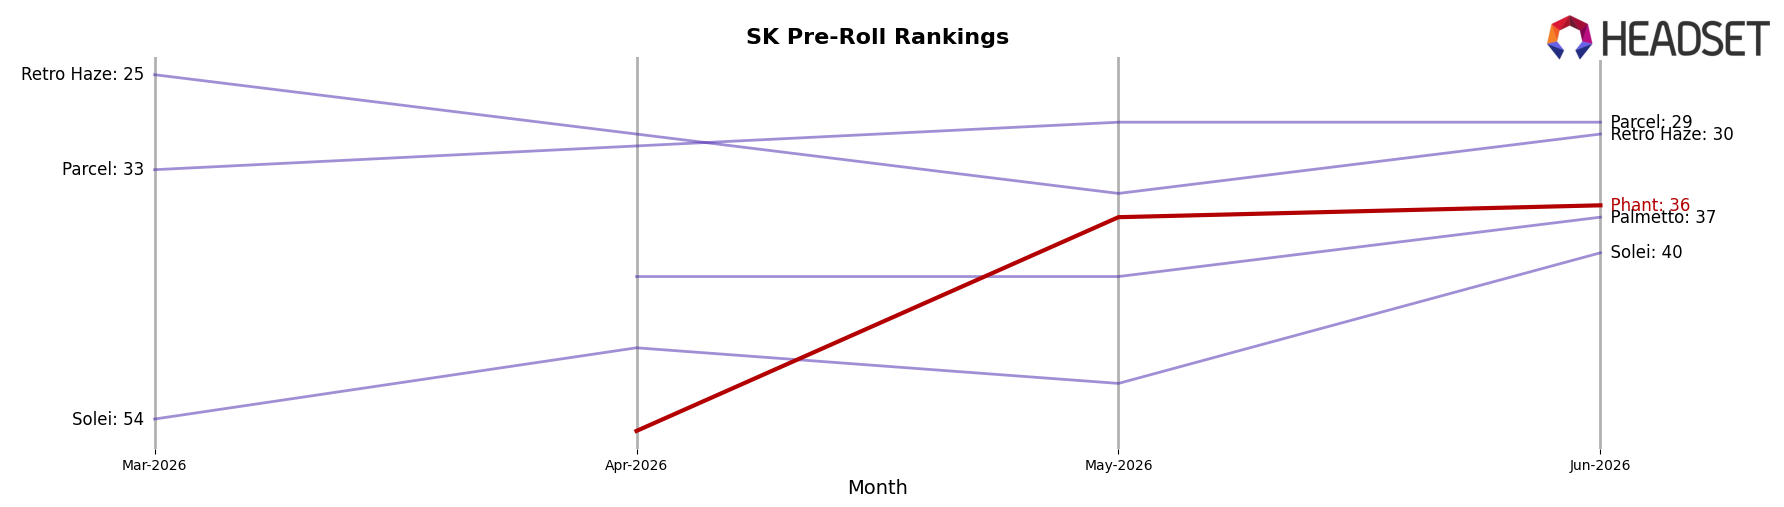
These shifts imply a positioning pivot: the 28.75% year-over-year growth in Pre-Roll alongside a 31.89% month-over-month decline in Concentrates suggests margin-for-volume tradeoffs that favor accessibility and frequency. Rank 36 in Pre-Roll within Saskatchewan, combined with Pre-Roll’s 43.78% share and Vapor Pens’ 98.52% year-over-year erosion, points to a focus on value-led inhalables over premium hardware-dependent formats. The implication is a need to lean into Pre-Roll differentiation and defend the 53.55% Concentrates share from further 31%+ monthly swings, using price architecture to convert share without overexposing to volatility.
Competitive Landscape
Phant sits at rank #36 in SK Pre-Roll in June 2026, improving 56 positions year over year from #92 and climbing 20 spots since March 2026 from #56; this also marks a peak rank of #36 in June 2026. In contrast, Back Forty / Back 40 Cannabis held #1 both year over year and in June 2026 while growing sales 134%, and Doobie Snacks advanced from #9 to #3 alongside a 282% sales increase; the directional gap indicates Phant’s rank gains are driven more by share re-entry than outsized category momentum. The pattern implies Phant’s trajectory is upward but still constrained by leaders consolidating top-5 positions, so sustaining share will require converting rank recovery into velocity amid competitors that are stable at #1–#5 and posting double- to triple-digit growth.
Notable Products
Sour Tangie Live Resin (1g) posted the largest month-over-month gain at 110.18% and entered tied rank 6, while Bubble Yam Hash (2g) fell 61.90% to rank 4. Tropical Breeze Diamonds (1g) also surged 68.10% to rank 2, whereas Nuclear Sour Flavored THCA Diamonds (1g) declined 13.99% at rank 3. Four of the top ten are Concentrates SKUs, and this tilt alongside a -1.78% slip for Gingerbread Flavored Diamond Infused Pre-Roll (1g) at rank 1 suggests mix is rotating toward value-seeking concentrate buyers rather than relying on a single flagship pre-roll.
Top Selling Cannabis Brands
Data for this report comes from real-time sales reporting by participating cannabis retailers via their point-of-sale systems, which are linked up with Headset’s business intelligence software. Headset’s data is very reliable, as it comes digitally direct from our partner retailers. However, the potential does exist for misreporting in the instance of duplicates, incorrectly classified products, inaccurate entry of products into point-of-sale systems, or even simple human error at the point of purchase. Thus, there is a slight margin of error to consider. Brands listed on this page are ranked in the top twenty within the market and product category by total retail sales volume.

