Oct-2025
Sales
Trend
6-Month
Product Count
SKUs
Overview
Market Insights Snapshot
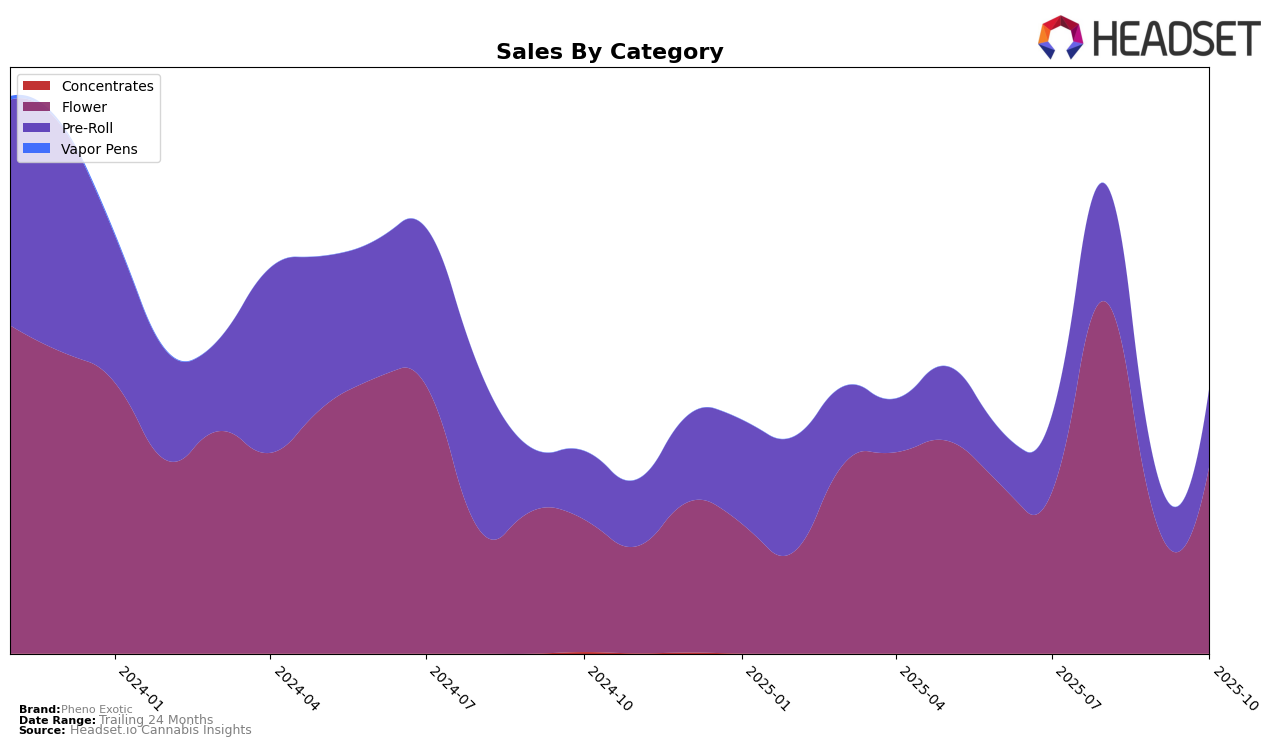
Pheno Exotic has shown notable fluctuations in its performance across different cannabis categories and states. In the Nevada market, the brand's presence in the Flower category has been inconsistent. Starting in July 2025, Pheno Exotic was ranked 48th, but it climbed to 25th in August, only to drop to 51st in September, before recovering slightly to 37th in October. This volatility reflects challenges in maintaining a steady market position, which could be due to varying consumer preferences or competitive pressures. Despite these fluctuations, the brand's sales in the Flower category saw a significant spike in August, indicating a potential seasonal or promotional influence.
In the Pre-Roll category within Nevada, Pheno Exotic has shown a more stable but still varied performance. The brand improved its ranking from 32nd in July to 20th in August, a positive movement that suggests effective marketing or product reception during that period. However, similar to the Flower category, the ranking slipped to 41st in September before improving to 29th in October. The sales data mirrors this trend, with August being a peak month. The fact that Pheno Exotic did not secure a consistent top 30 position across the months in either category highlights both the competitive nature of the cannabis market in Nevada and the potential areas for strategic improvement for the brand.
Competitive Landscape
In the competitive landscape of the Nevada flower category, Pheno Exotic has experienced notable fluctuations in its market position from July to October 2025. Starting at a rank of 48 in July, Pheno Exotic made a significant leap to 25 in August, indicating a strong surge in sales momentum. However, this was followed by a dip to 51 in September, before recovering to 37 in October. This volatility suggests a dynamic market environment where Pheno Exotic is competing against brands like The Grower Circle, which maintained a relatively stable position around the low 30s, and Prime Cannabis, which saw a similar fluctuation in rankings. Meanwhile, Cookies and Remedy have shown varying degrees of stability and growth, with Remedy making a notable jump from outside the top 50 to 33 in October. These shifts highlight the competitive pressures Pheno Exotic faces, emphasizing the need for strategic marketing and product differentiation to sustain and improve its market position.

Notable Products
In October 2025, Pheno Exotic's top-performing product was Strawberry Skrilla #4 (3.5g) in the Flower category, achieving the number one rank with sales of 965 units. Following closely were Chem Dawg Pre-Roll (1g) and Alien Moonshine Pre-Roll (1g), ranking second and third, respectively, in the Pre-Roll category. Alien Mints X Permanent Marker Pre-Roll (1g) and Dark Cherry Pre-Roll (1g) rounded out the top five, demonstrating strong performance in the Pre-Roll segment. Compared to previous months, these products maintained their high rankings, indicating consistent consumer preference. The stable rankings suggest a strong and sustained demand for these top-tier products from Pheno Exotic.
Top Selling Cannabis Brands
Data for this report comes from real-time sales reporting by participating cannabis retailers via their point-of-sale systems, which are linked up with Headset’s business intelligence software. Headset’s data is very reliable, as it comes digitally direct from our partner retailers. However, the potential does exist for misreporting in the instance of duplicates, incorrectly classified products, inaccurate entry of products into point-of-sale systems, or even simple human error at the point of purchase. Thus, there is a slight margin of error to consider. Brands listed on this page are ranked in the top twenty within the market and product category by total retail sales volume.


