Apr-2026
Sales
Trend
6-Month
Product Count
SKUs
Avg Price
YoY Sales Change
YoY Price Change
Market Insights Snapshot
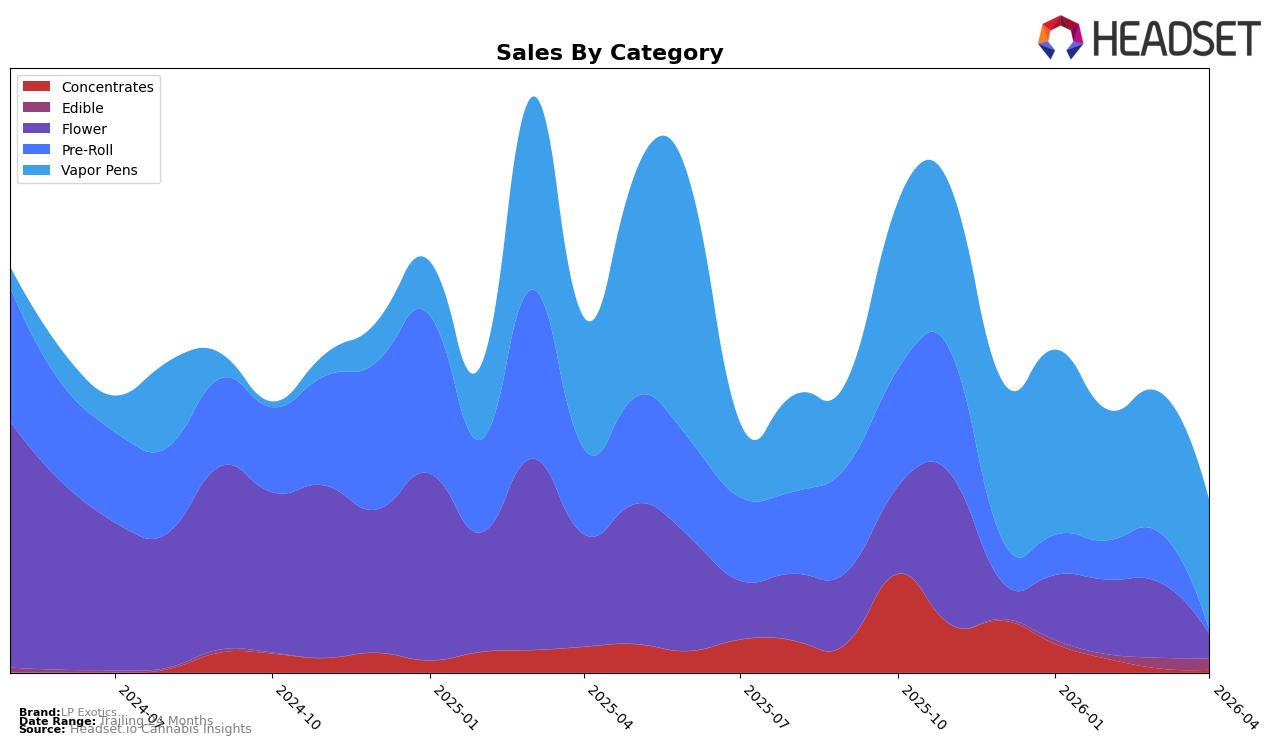
LP Exotics has shown a varied performance across different product categories in Nevada. In the Concentrates category, the brand started the year with a rank of 20 in January, but slipped to 27 by February, and did not make it to the top 30 in March and April. This indicates a declining trend in their market presence for Concentrates. In contrast, their performance in the Pre-Roll category improved significantly, with a jump from rank 42 in February to 32 in March. However, they did not sustain this momentum into April, as they were not ranked in the top 30, which could be a point of concern for the brand.
In the Flower category, LP Exotics maintained a relatively stable position, although they experienced a downward trend from January to April, moving from rank 53 to 76. This suggests a consistent yet weakening hold in this segment. The Vapor Pens category, however, has been a stronghold for LP Exotics, maintaining a top 30 position throughout the first four months of the year, despite a slight drop from 17 in January to 26 in April. The brand's absence from the Edible category's top 30 until April, when they ranked 33, highlights an area with potential for growth. These insights suggest that while LP Exotics has strengths in certain areas, there are opportunities and challenges that need to be addressed to optimize their market performance across categories.
Competitive Landscape
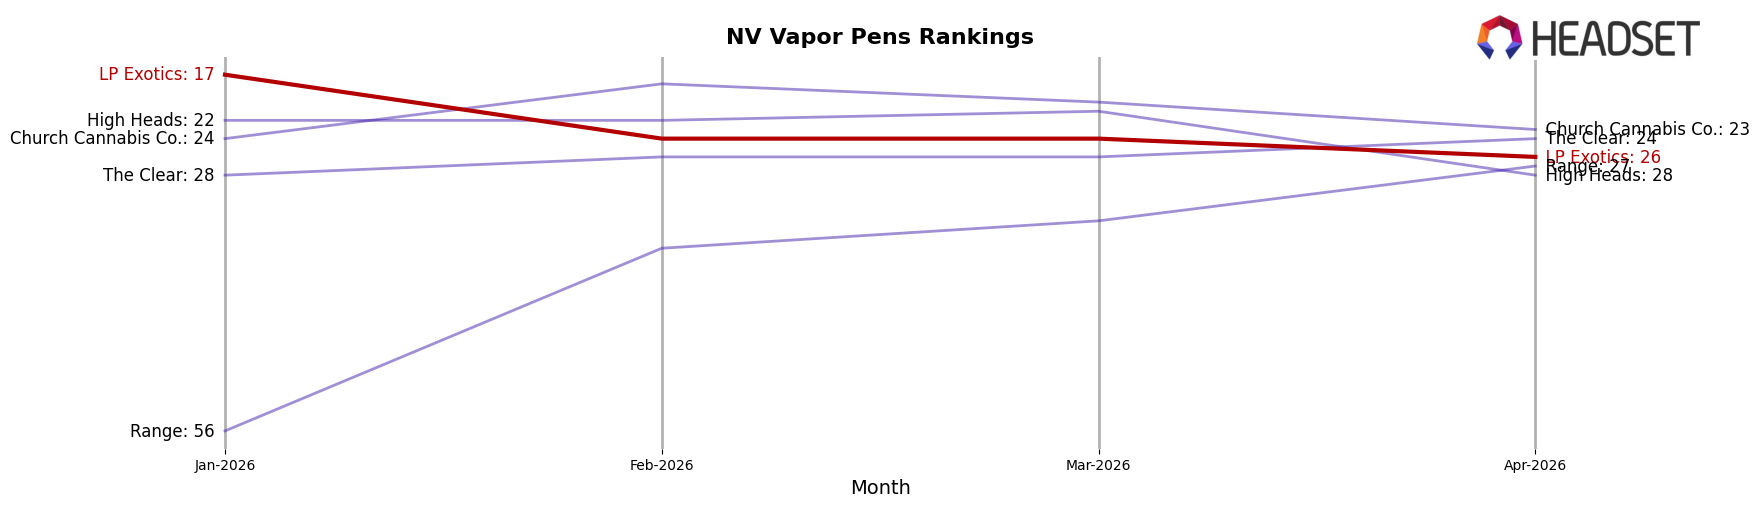
In the competitive landscape of Vapor Pens in Nevada, LP Exotics has experienced notable fluctuations in its ranking and sales performance from January to April 2026. Initially positioned at 17th in January, LP Exotics saw a decline to 24th in February and March, before dropping further to 26th in April. This downward trend contrasts with the performance of competitors such as Church Cannabis Co., which maintained a relatively stable ranking, peaking at 18th in February and ending at 23rd in April. Similarly, The Clear showed a consistent improvement, moving from 28th to 24th over the same period. Meanwhile, Range demonstrated a significant upward trajectory, climbing from 56th to 27th. These shifts suggest increasing competition and a dynamic market environment, which may require LP Exotics to reassess its strategies to regain its earlier standing and enhance sales performance.
Notable Products
In April 2026, Sub Zero #12 Live Resin Cartridge (1g) emerged as the top-performing product for LP Exotics, leading the sales with a notable figure of 756 units sold. Following closely, Jealousy x Superboof Live Resin Cartridge (1g) and Permanent Marker Live Resin Cartridge (1g) secured the second and third positions, respectively, in the Vapor Pens category. Gelato (3.5g) ranked fourth in the Flower category, while Biscotti Sherb Live Resin Cartridge (1g) maintained its fifth position from March to April. Notably, the top three products made their debut in the rankings for April, indicating a strong market entry. Meanwhile, Biscotti Sherb experienced a decrease in sales from March to April, suggesting a shift in consumer preference towards other new entrants.
Top Selling Cannabis Brands
Data for this report comes from real-time sales reporting by participating cannabis retailers via their point-of-sale systems, which are linked up with Headset’s business intelligence software. Headset’s data is very reliable, as it comes digitally direct from our partner retailers. However, the potential does exist for misreporting in the instance of duplicates, incorrectly classified products, inaccurate entry of products into point-of-sale systems, or even simple human error at the point of purchase. Thus, there is a slight margin of error to consider. Brands listed on this page are ranked in the top twenty within the market and product category by total retail sales volume.

