Market Insights Snapshot
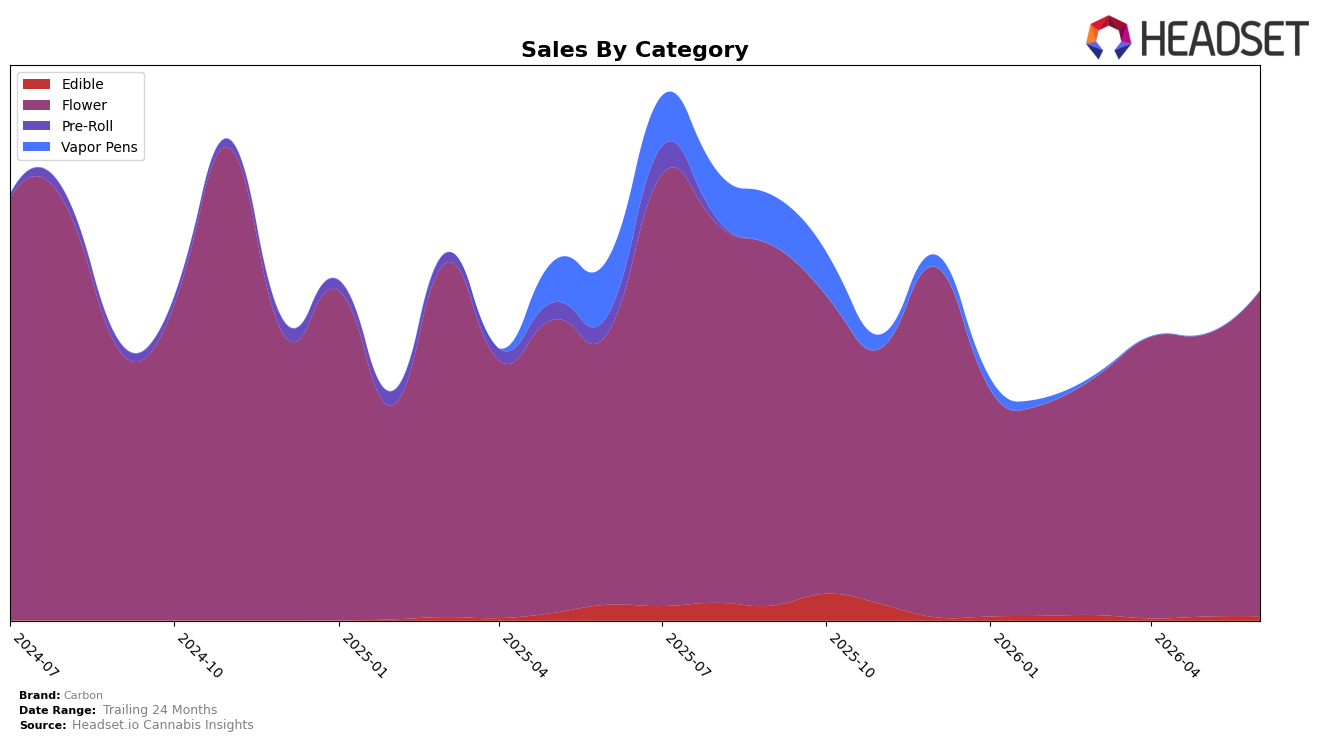
In June 2026, Carbon concentrated 98.77% of sales in Flower, up with Flower sales growing 19.41% year over year and 15.34% month over month, while Edible held 1.23% share with a 74.20% year-over-year decline but a 6.85% month-over-month uptick. This skew coexists with a 54.98% year-over-year increase in average price to $14.82 and an overall brand sales decline of 8.91% year over year, implying mix-led exposure to Flower volume swings even as price rises offset some unit pressure.
Positioning-wise, anchoring in Flower at a 98.77% mix and holding rank 20 in Flower in Michigan suggests Carbon competes on depth within a single category rather than portfolio breadth, with the 15.34% month-over-month Flower lift outpacing the 6.85% month-over-month Edible recovery. The combination of a 54.98% price increase and a 19.41% year-over-year Flower sales gain, against a 40.76% 24-month brand sales decline, indicates reliance on premiumization within Flower to stabilize near-term momentum while longer-horizon share erosion limits cross-category insulation.
Competitive Landscape
Carbon sits at rank #20 in MI Flower in June 2026, a 10-place climb from #30 year over year, while its three-month position also moved from #30 to #20 over the same horizon; this puts current standing 8 spots below its peak of #12 from June 2024 and 19 places behind High Minded at #1, whose sales declined 13.7% year over year. In contrast, Goodlyfe Farms advanced from #5 to #2 with 44.1% YoY sales growth, and Mischief jumped from #13 to #5 alongside 146.1% YoY growth; this relative movement implies Carbon’s rank recovery is outpaced by faster-advancing peers, signaling that sustaining double-digit share gains or distribution wins is required to convert mid-pack momentum into a return toward its June 2024 peak.

Notable Products
98 Super Silver Haze (3.5g) posted the largest month-over-month gain at +301.9% to rank 1 in June 2026, vaulting ahead of prior leaders and concentrating nearly $98,733 into a single Flower SKU, while Animal Mint Cake (3.5g) fell -58.2% yet still held rank 5. Pebble Wreck (3.5g) rose +167.7% to rank 2 and Iced Cherry Cookies (3.5g) climbed +76.0% to rank 3, with nine of the top ten positions occupied by Flower formats that span both legacy eighths and one bulk entry. Cherry Poptart (3.5g) added +21.6% at rank 9 alongside a new or returning cohort with null MoM baselines anchoring ranks 4, 6, 7, 8, and 10, indicating assortment refresh rather than broad pullback. The pattern points to Carbon leaning into high-velocity Flower bets where breakout skus can scale rapidly while pruning underperforming strains, signaling a portfolio tilted toward fast-turn eighths with opportunistic bulk support.
Top Selling Cannabis Brands
Data for this report comes from real-time sales reporting by participating cannabis retailers via their point-of-sale systems, which are linked up with Headset’s business intelligence software. Headset’s data is very reliable, as it comes digitally direct from our partner retailers. However, the potential does exist for misreporting in the instance of duplicates, incorrectly classified products, inaccurate entry of products into point-of-sale systems, or even simple human error at the point of purchase. Thus, there is a slight margin of error to consider. Brands listed on this page are ranked in the top twenty within the market and product category by total retail sales volume.

