.svg)

Sep-2026
Sales
Trend
6-Month
Product Count
SKUs
Avg Price
YoY Sales Change
YoY Price Change


Where to Buy
Pinpoint is stocked at 65 licensed dispensaries across Missouri, with the deepest coverage in Kansas City, St. Louis, Columbia, Branson, and Cape Girardeau. Search by ZIP code or city below to find the closest one, or filter by product type if you are after a specific format.
Market Insights Snapshot
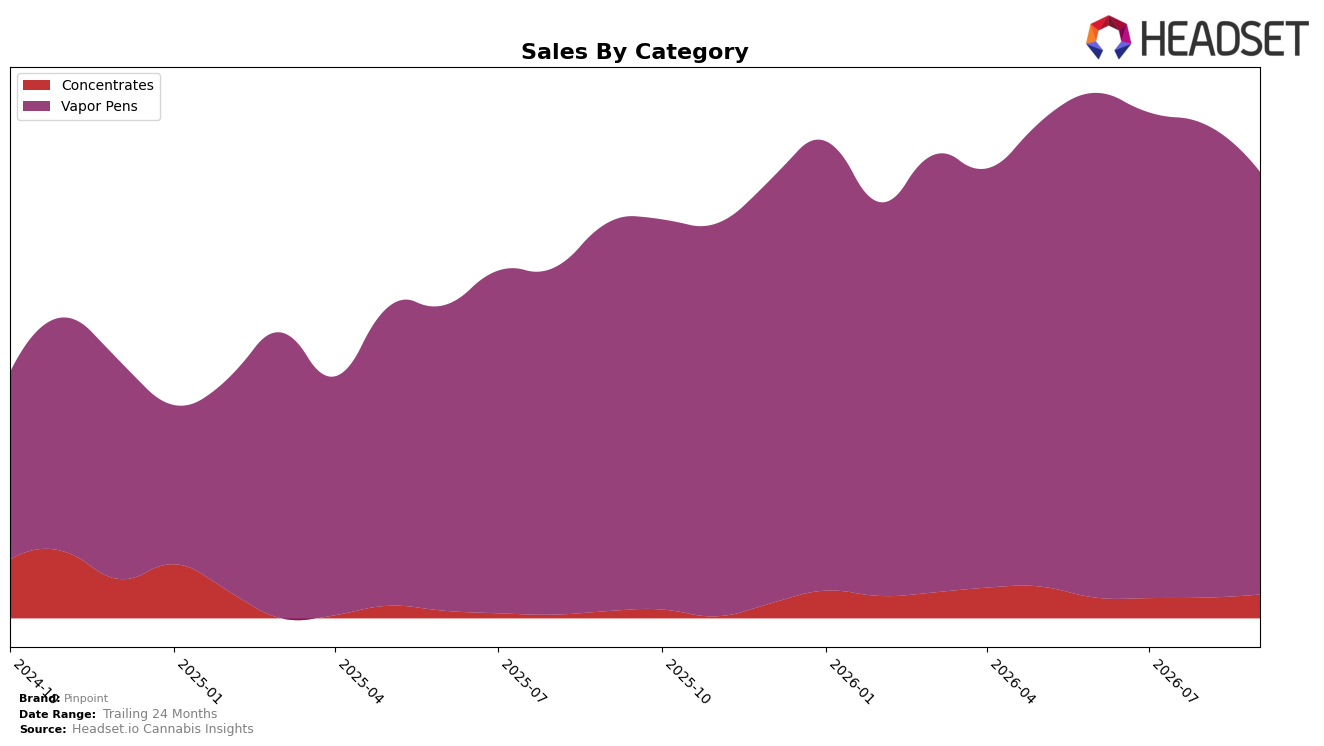
In September 2026, Pinpoint concentrated 90.09% of sales in Vapor Pens, while Concentrates accounted for 9.91%, mapping a two-category portfolio with divergent trajectories. Vapor Pens declined month over month by 10.16% despite a 8.26% year-over-year rise, whereas Concentrates expanded 6.78% month over month and 50.48% year over year, with a higher average price of $47.67 versus $33.49. With overall average price up 4.38% year over year and brand sales up 11.35% year over year, the mix shift implies that growth is increasingly carried by higher-priced Concentrates even as the larger Vapor Pens base softens sequentially, pointing to margin leverage concentrated outside the core.
Pinpoint holds rank 4 in Vapor Pens in Missouri, yet the category’s 10.16% month-over-month dip contrasts with a 6.78% month-over-month lift in Concentrates, suggesting share stability at the category rank may rely on stemming sequential softness in the flagship segment. Given a 50.48% year-over-year rise in Concentrates alongside an 8.26% year-over-year increase in Vapor Pens, the portfolio is tilting toward premium-price units, which can support pricing power if maintained, but leaves positioning exposed if Vapor Pens mix remains above 90.00% while momentum concentrates in a sub-10.00% slice.
Competitive Landscape
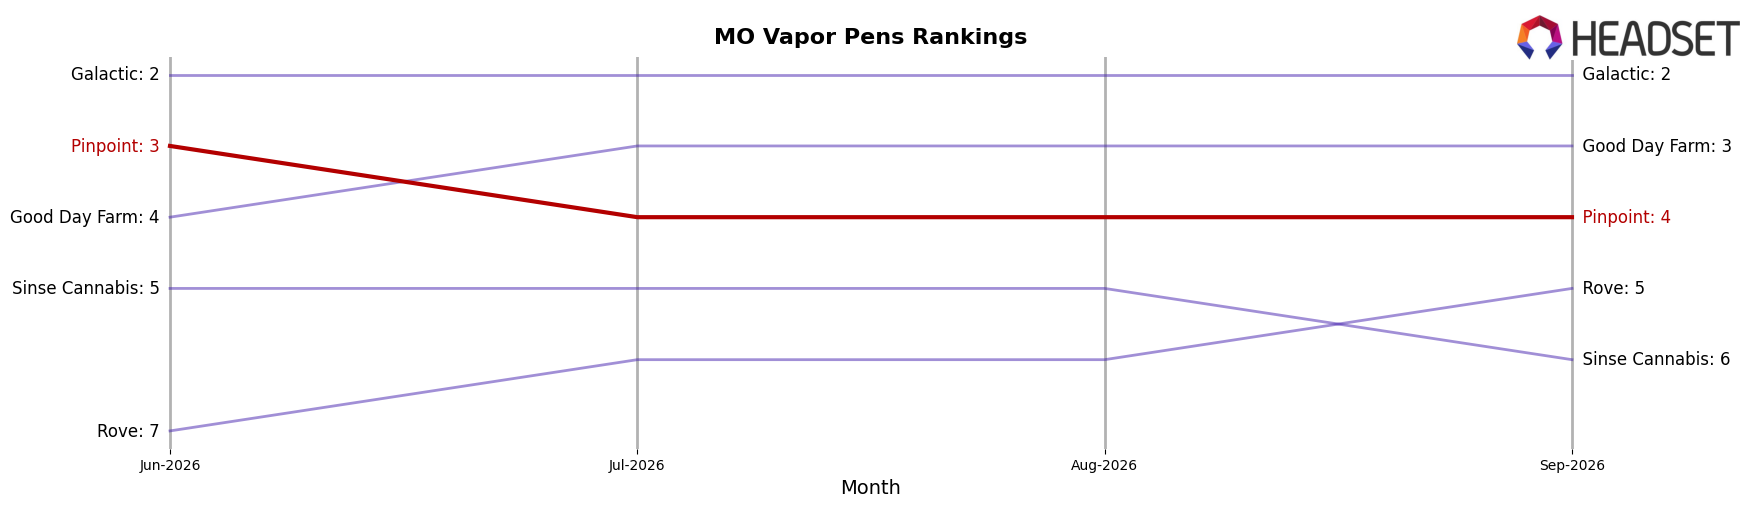
Pinpoint ranks #4 in MO Vapor Pens in September 2026, unchanged year over year at #4 but down one position from #3 in June 2026, while category leader Illicit / Illicit Gardens held #1 year over year and remains #1, and Good Day Farm advanced from #5 year over year to #3 as of September 2026 with a 35.36% sales increase; meanwhile, Rove slid from #3 year over year to #5 with a 4.34% sales decline. Pinpoint’s peak at #3 in June 2026 followed by a drop to #4 by September 2026, alongside Galactic holding #2 with 20.41% YoY sales growth and Good Day Farm’s upward move, indicates Pinpoint is getting bracketed by faster risers and needs share defense rather than expecting organic rank recovery.
Notable Products
Rainbow Belts Distillate Cartridge (1g) posted the steepest decline at -43.3% MoM while holding rank 3, and Banana Runtz Distillate Cartridge (1g) fell -21.2% at rank 1, indicating demand is concentrating at the top despite sharp pullbacks. Slurricane Distillate Cartridge (1g) dropped -24.2% at rank 2, and Northern Lights Distillate Cartridge (1g) slid -27.3% at rank 5, while Sunny DDD Distillate Disposable (1g) decreased -12.5% at rank 9, showing cartridges are contracting faster than disposables where Island Delights Distillate Disposable (1g) rose +7.9% at rank 8. Nine of the top ten are Vapor Pens SKUs within cartridges and disposables, and only one SKU shows positive MoM, implying Pinpoint’s September 2026 product mix is overexposed to a cooling cartridge segment and may need more disposable-led variety to stabilize share.
Top Selling Cannabis Brands






Data for this report comes from real-time sales reporting by participating cannabis retailers via their point-of-sale systems, which are linked up with Headset’s business intelligence software. Headset’s data is very reliable, as it comes digitally direct from our partner retailers. However, the potential does exist for misreporting in the instance of duplicates, incorrectly classified products, inaccurate entry of products into point-of-sale systems, or even simple human error at the point of purchase. Thus, there is a slight margin of error to consider. Brands listed on this page are ranked in the top twenty within the market and product category by total retail sales volume.

