May-2026
Sales
Trend
6-Month
Product Count
SKUs
Avg Price
YoY Sales Change
YoY Price Change
Market Insights Snapshot
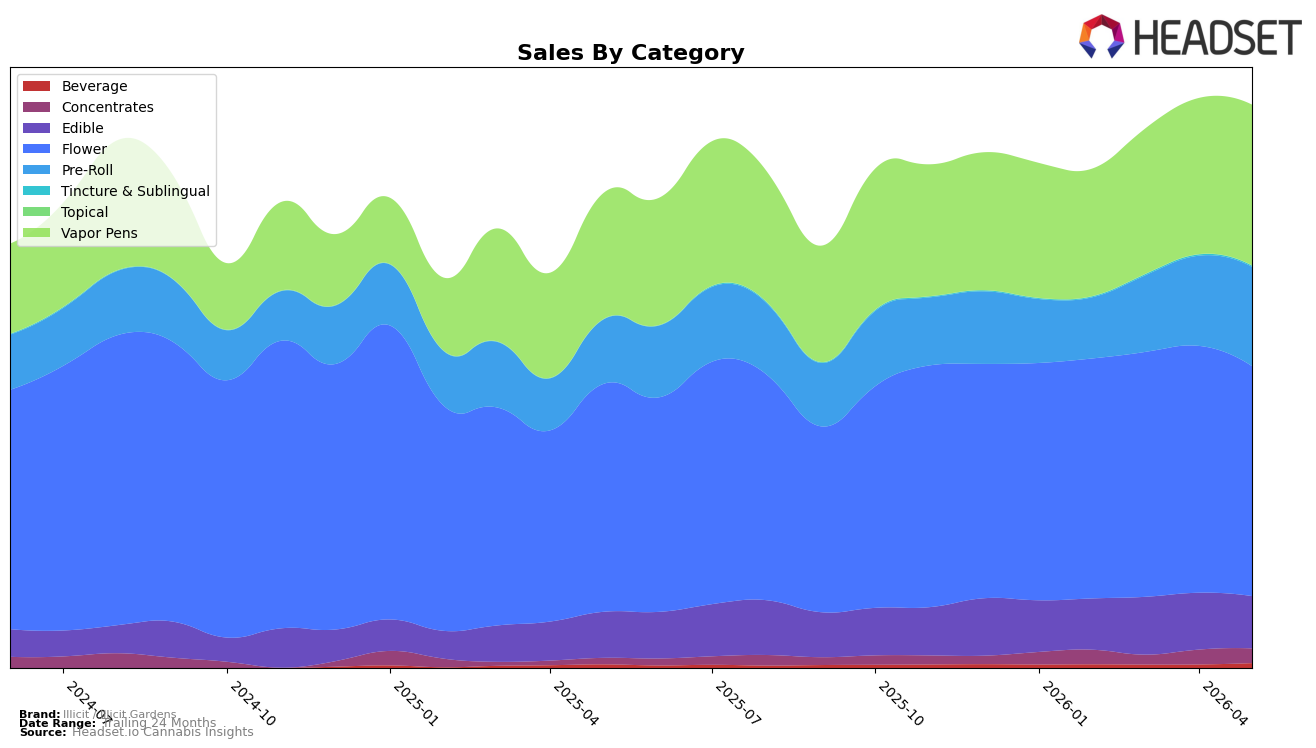
Illicit / Illicit Gardens concentrated 40.91% of May 2026 sales in Flower, yet Flower slid month over month by 6.87% while edging up 0.88% year over year, indicating a soft short-term pull against a flat YoY trajectory. Vapor Pens held 28.58% share with 2.94% MoM growth and 27.69% YoY growth, while Pre-Roll expanded to 17.64% share on 10.19% MoM and 54.54% YoY gains. Edible at 9.27% share contracted 8.09% MoM despite a 13.67% YoY lift, and Concentrates, though only 2.58% share, posted 133.01% YoY with a slight 0.67% MoM dip. Beverage climbed 37.64% MoM and 33.29% YoY but remained 0.87% of mix, and Tincture & Sublingual fell 10.43% MoM to 0.16% share. The pattern implies a rotation where faster-growing inhalables (Vapor Pens and Pre-Roll) are absorbing mix from Flower on a monthly basis, cushioning brand-level YoY growth of 18.68% even as average price declined 6.84%.
Positioning-wise, reliance on Flower at 40.91% share with a MoM decline of 6.87% alongside a state-category ranking of 2 in Missouri suggests maintaining high rank requires leaning into momentum categories rather than defending volume solely in Flower. The double-digit YoY surges in Pre-Roll (54.54%) and Vapor Pens (27.69%) paired with a 6.84% brand-wide average price decrease indicate consumers are trading into value-accessible inhalables, while Edible’s 8.09% MoM dip and Concentrates’ 0.67% MoM slip caution against over-indexing on non-inhalable or niche formats. Beverage’s 37.64% MoM spike from a 0.87% base and Concentrates’ 133.01% YoY growth show optionality at the edges, but the implication is to prioritize share capture in Vapor Pens and Pre-Roll to stabilize monthly volatility and support rank, using selective price architecture to protect mix without over-discounting Flower.
Competitive Landscape
Illicit / Illicit Gardens sits at rank #2 in MO Flower in May 2026, up 1 position YoY from #3 and up 1 position from #3 in February 2026, marking a new peak rank of #2 in May 2026. Against peers, Flora Farms held #1 both YoY and currently while posting a -17.8% YoY sales change, whereas CODES slipped from #2 YoY to #3 currently with a -30.6% YoY sales change, indicating Illicit / Illicit Gardens advanced while a top rival moved backward. Meanwhile, Sinse Cannabis climbed from #5 YoY to #4 with +27.5% YoY sales and Good Day Farm rose from #9 YoY to #5 with +1.1% YoY sales, suggesting rising pressure just below; the pattern implies Illicit / Illicit Gardens’ step-up to #2 is defensible short term but will require share reinforcement to prevent an upward challenge from fast-moving followers.

Notable Products
Gorilla Pie (3.5g) posted the steepest decline at -47.8% month over month, sliding to rank 6 while Chem Butter (3.5g) fell -15.0% to rank 4, indicating a pullback within mid-tier Flower. In contrast, Ghost OG (3.5g) rose +18.7% to hold rank 1 and GMO Cookies (3.5g) gained +11.2% at rank 2, creating a widening gap between leaders and laggards. With four of the top ten coming from Flower and Pre-Rolls occupying ranks 5, 8, and 9, the mix implies Illicit / Illicit Gardens is consolidating around a few flagship Flower SKUs while using Pre-Rolls to stabilize share amid volatility in secondary Flower strains.
Top Selling Cannabis Brands
Data for this report comes from real-time sales reporting by participating cannabis retailers via their point-of-sale systems, which are linked up with Headset’s business intelligence software. Headset’s data is very reliable, as it comes digitally direct from our partner retailers. However, the potential does exist for misreporting in the instance of duplicates, incorrectly classified products, inaccurate entry of products into point-of-sale systems, or even simple human error at the point of purchase. Thus, there is a slight margin of error to consider. Brands listed on this page are ranked in the top twenty within the market and product category by total retail sales volume.

