Jun-2026
Sales
Trend
6-Month
Product Count
SKUs
Avg Price
YoY Sales Change
YoY Price Change
Market Insights Snapshot
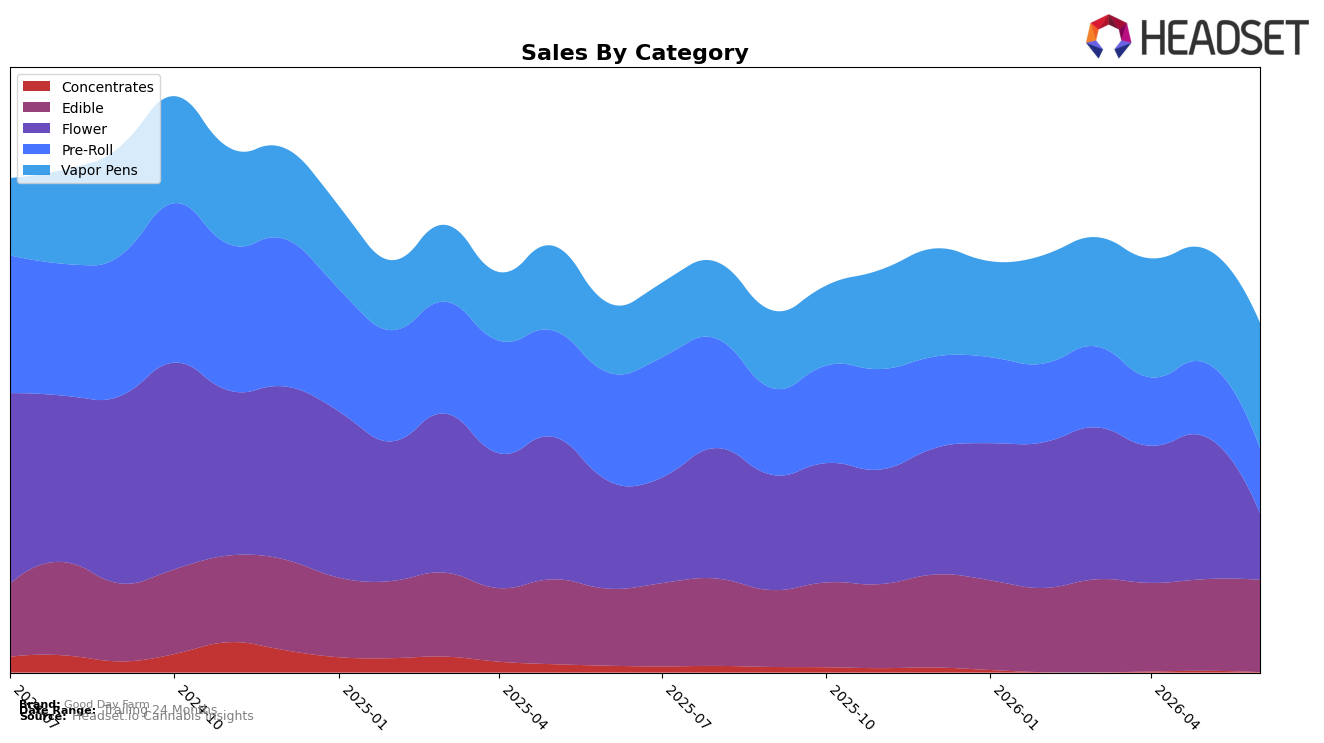
Good Day Farm’s category mix in June 2026 tilted toward Vapor Pens at 35.58% share with 78.78% year-over-year growth and 9.88% month-over-month lift, while Edible held 26.26% share with 19.37% YoY and 0.61% MoM gains. In contrast, Flower fell to 19.10% share with a 37.68% YoY decline and a 52.79% MoM drop, and Pre-Roll slid to 18.62% share with a 39.54% YoY decline and 11.77% MoM decline; Concentrates compressed to 0.45% share with a 79.96% YoY and 45.27% MoM decline. Despite a 4.65% YoY decrease in average price across the brand, Vapor Pens carried higher average pricing at $38.53 versus Edible at $13.74, implying a revenue mix pivot toward higher-priced inhalables even as Flower and Pre-Roll contracted.
The simultaneous surge in Vapor Pens and stability in Edible, paired with steep retrenchment in Flower and Pre-Roll, implies a deliberate repositioning toward inhalable convenience and confectionary consistency rather than value-driven bulk formats; this aligns with a rank of 2 in Vapor Pens in Missouri and suggests headroom to trade up within that segment. Given total brand sales down 5.29% YoY and a 23.69% decline over 24 months alongside a 4.65% YoY price decrease, the pattern points to margin defense via category mix rather than across-the-board discounting, with June 2026’s 9.88% MoM growth in Vapor Pens offsetting the 52.79% MoM contraction in Flower to concentrate share where price and rank support differentiation.
Competitive Landscape
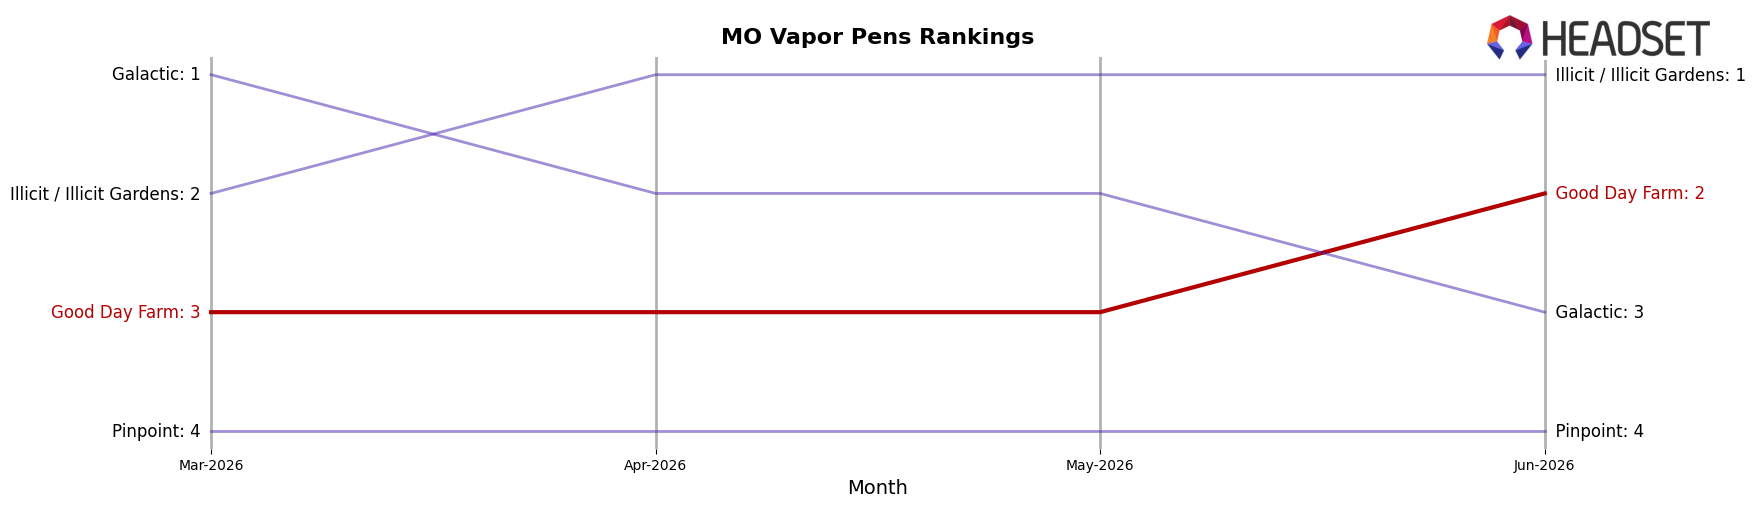
Good Day Farm is ranked #2 in MO Vapor Pens in June 2026, improving 8 positions year over year from #10, and edging up 1 rank from #3 three months ago to a new peak at #2 in June 2026; this puts it directly behind Illicit / Illicit Gardens, which held #1 both this year and last while growing sales by 27.6%, and ahead of Galactic, which sits at #3 after rising from #5 with 51.7% YoY sales growth. The separation is further pressured by Pinpoint climbing from #7 to #4 on 72.0% YoY growth and Sinse Cannabis moving from #9 to #5 with 41.4% YoY growth, indicating that Good Day Farm’s rapid rank ascent must convert into share defense against faster-growing followers and a stable #1 incumbent.
Notable Products
Nano - CBD/THC/CBN Night Night Gummies 10-Pack (60mg CBD, 40mg THC, 40mg CBN) posted the most interesting movement with a +11.6% month-over-month rise to rank 3, while Go - Blue Raspberry Smash Distillate Disposable (1g) slipped 4.3% to rank 4, indicating a tilt toward functional edibles over inhalables in June 2026. Big AF - Strawberry Pineapple Gummy (100mg) climbed 13.9% at rank 1 and Big AF - Cranberry Grape Gummy (100mg) in rank 2 added 2.5%, and with seven of the top ten coming from Edibles the concentration suggests basket share is consolidating in gummies rather than vapor pens. Vapor pen cartridges at ranks 6 and 8 fell 0–4% MoM while edible SKUs at ranks 1, 3, and 5 posted gains between +6% and +14%, and only one top-five item logged a decline, pointing to a category mix that is skewing toward repeatable, dose-defined formats despite a $317,002 anchor from the leading disposable. The pattern implies Good Day Farm is pivoting its commercial emphasis toward multi-SKU gummy depth where small percentage lifts compound share, while inhalables are serving as volume stabilizers rather than growth drivers.
Top Selling Cannabis Brands
Data for this report comes from real-time sales reporting by participating cannabis retailers via their point-of-sale systems, which are linked up with Headset’s business intelligence software. Headset’s data is very reliable, as it comes digitally direct from our partner retailers. However, the potential does exist for misreporting in the instance of duplicates, incorrectly classified products, inaccurate entry of products into point-of-sale systems, or even simple human error at the point of purchase. Thus, there is a slight margin of error to consider. Brands listed on this page are ranked in the top twenty within the market and product category by total retail sales volume.

