May-2026
Sales
Trend
6-Month
Product Count
SKUs
Avg Price
YoY Sales Change
YoY Price Change
Market Insights Snapshot
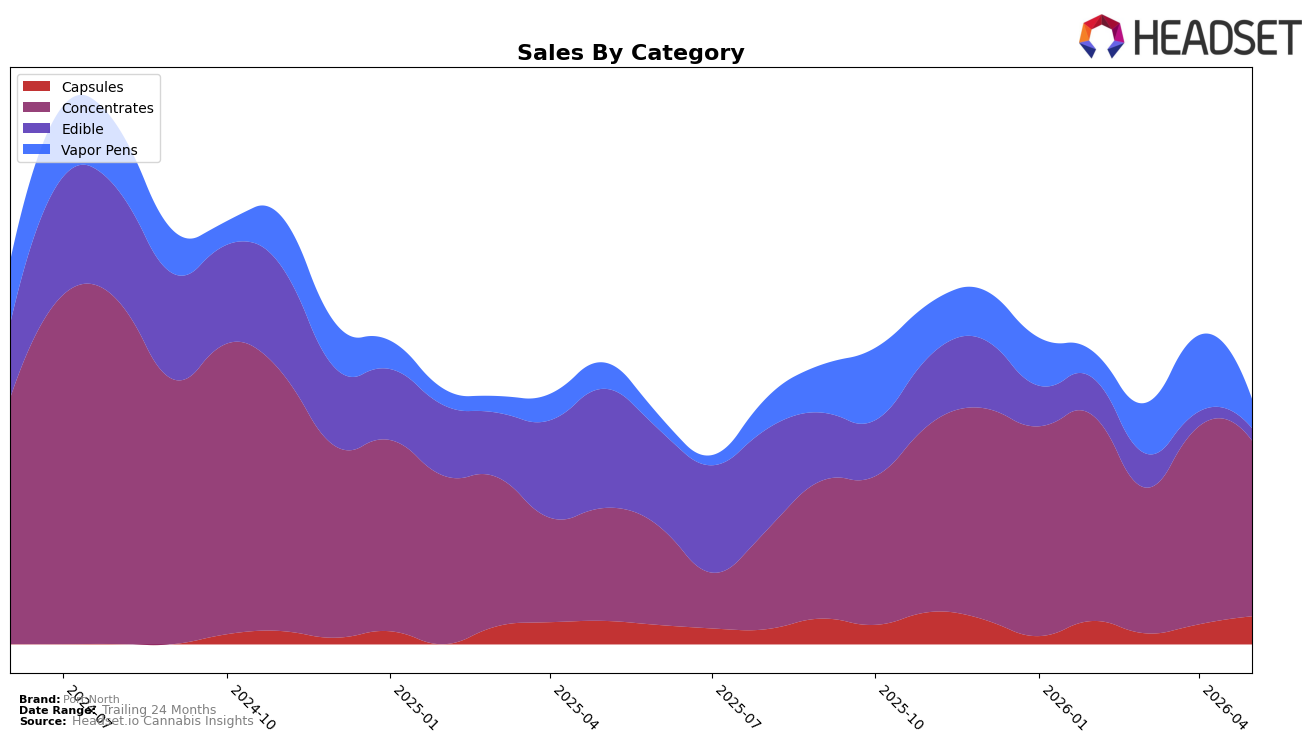
In May 2026, Port North’s mix skewed heavily to Concentrates at 71.79% share, up 55.91% year over year but down 11.23% month over month, while Vapor Pens held 11.86% share with 11.13% YoY growth and a 61.90% MoM decline. Capsules rose to 11.39% share with 19.70% YoY growth and a 40.83% MoM increase, as Edible fell to 4.96% share with an 89.80% YoY contraction and a 16.45% MoM drop. Despite brand-level sales down 12.98% YoY and an average price up 223.45% YoY to $24.17, the category-level divergence implies Port North is consolidating around higher-priced inhalable formats while rapidly exiting low-price Edible volume.
With Concentrates dominance and a rank of 51 in Ontario Concentrates, the 11.23% MoM pullback alongside a 40.83% MoM surge in Capsules suggests a hedging move toward dose-controlled formats to buffer volatility in inhalables. The simultaneous 61.90% MoM decline in Vapor Pens and 89.80% YoY collapse in Edible indicate reliance on a narrow core that amplifies pricing power but raises exposure to category swings; the mix shift implies Port North’s positioning is migrating toward a potency-led niche with Capsules as a stabilizer rather than a volume-driven, multi-format footprint.
Competitive Landscape
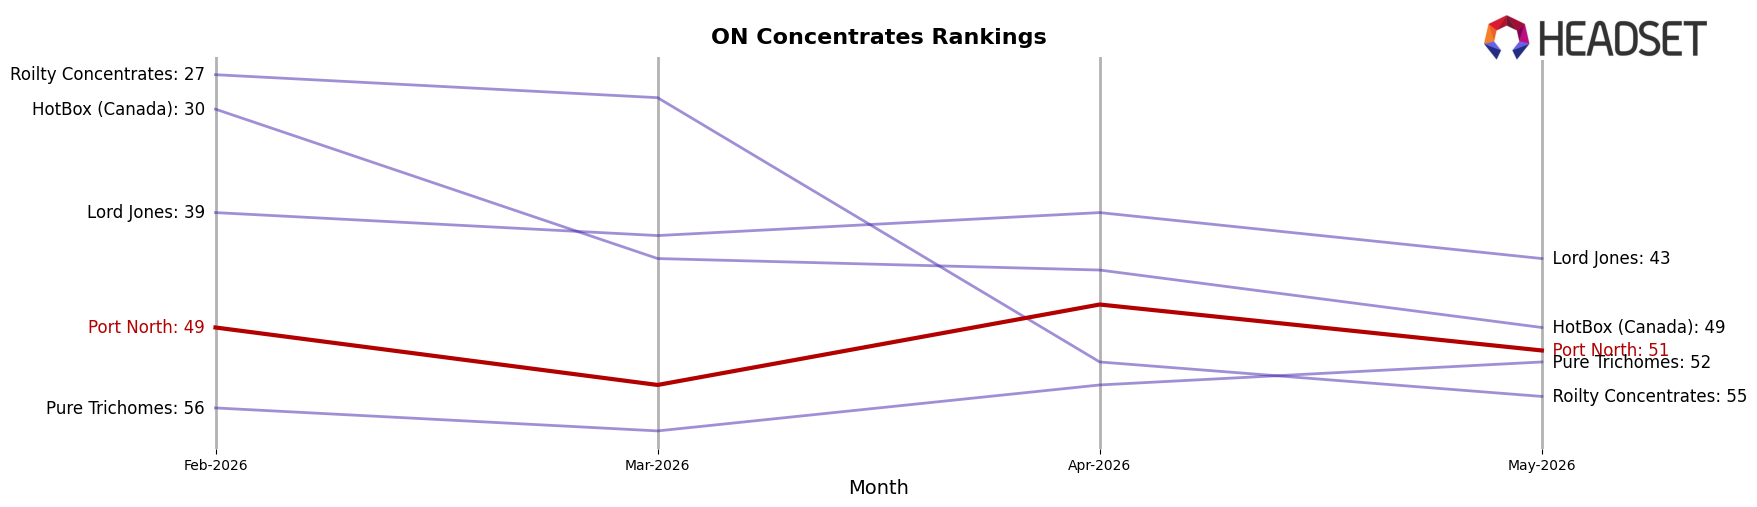
Port North sits at rank #51 in ON Concentrates in May 2026, a 1-place improvement from rank #52 year over year, but down 2 places from #49 in February 2026, signaling lateral movement rather than momentum; the brand remains well below its peak rank of #32 reached in July 2024, a 19-position gap that has not closed over the past 10 months. Competitive pressure intensified as Pura Vida climbed from #4 to #2 while growing sales year over year by 30.8%, and Tremblant Cannabis advanced from #7 to #4 with a 15.7% YoY increase, even as Endgame slid from #2 to #5 with a 49.7% YoY decline; this mix indicates Port North’s slight rank gain is not anchored to category-wide contraction at the top and implies that without a share-accretive push, the brand’s trajectory points to continued mid-pack stagnation rather than re-entry toward the top-30.
Notable Products
Jolly Hashers Soft Chews 2-Pack (10mg) posted a 646.2% month-over-month surge to rank 2 in May 2026, while Apricot Kush Full Spectrum Hash Soft Chews 2-Pack (10mg) collapsed by 94.2% to rank 9, indicating volatility within Edibles. Full Spectrum Cold Cured Live Rosin Batter (1g) held rank 1 despite a 7.5% decline, and Cherry Boat Hand Rolled Ice Water Hash (1g) fell 26.8% to rank 3, with three of the top ten coming from Concentrates. The mixed direction—triple-digit Edibles lift alongside double-digit declines in two Concentrates SKUs—suggests Port North is testing demand elasticity beyond its core, tilting the product mix toward trial-heavy Edibles while Concentrates maintain flagship status.
Top Selling Cannabis Brands
Data for this report comes from real-time sales reporting by participating cannabis retailers via their point-of-sale systems, which are linked up with Headset’s business intelligence software. Headset’s data is very reliable, as it comes digitally direct from our partner retailers. However, the potential does exist for misreporting in the instance of duplicates, incorrectly classified products, inaccurate entry of products into point-of-sale systems, or even simple human error at the point of purchase. Thus, there is a slight margin of error to consider. Brands listed on this page are ranked in the top twenty within the market and product category by total retail sales volume.

