Market Insights Snapshot
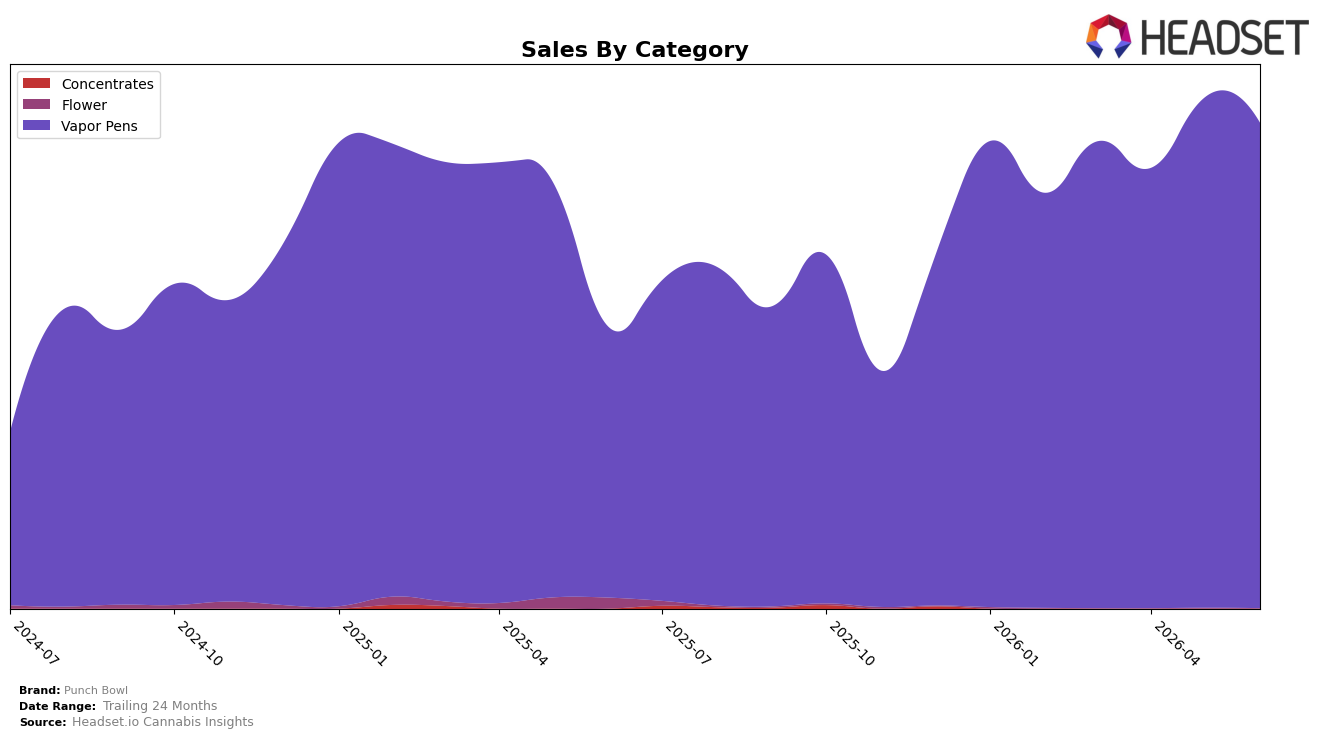
In June 2026, Punch Bowl concentrated 100.0% of sales in Vapor Pens, with category sales up 79.28% year over year and down 4.86% month over month, while brand-wide sales grew 72.53% YoY and average price declined 2.59% YoY to $16.38. Within Oregon Vapor Pens, the brand held rank 21, indicating mid-pack placement even as 24-month growth reached 323.80%, implying a scale-up that now leans on price elasticity rather than assortment breadth.
The shift toward a single-category footprint means pricing and velocity in Vapor Pens set the brand’s trajectory: a 4.86% MoM dip alongside a 79.28% YoY rise points to saturation risk at current price tiers and a need to trade mix within subtypes or SKUs rather than expand categories. Holding rank 21 in Vapor Pens while pricing slid 2.59% YoY suggests Punch Bowl is competing on accessible price bands to sustain volume, implying near-term gains will come from optimizing cartridge formats and potency ladders to improve rank before pursuing diversification.
Competitive Landscape
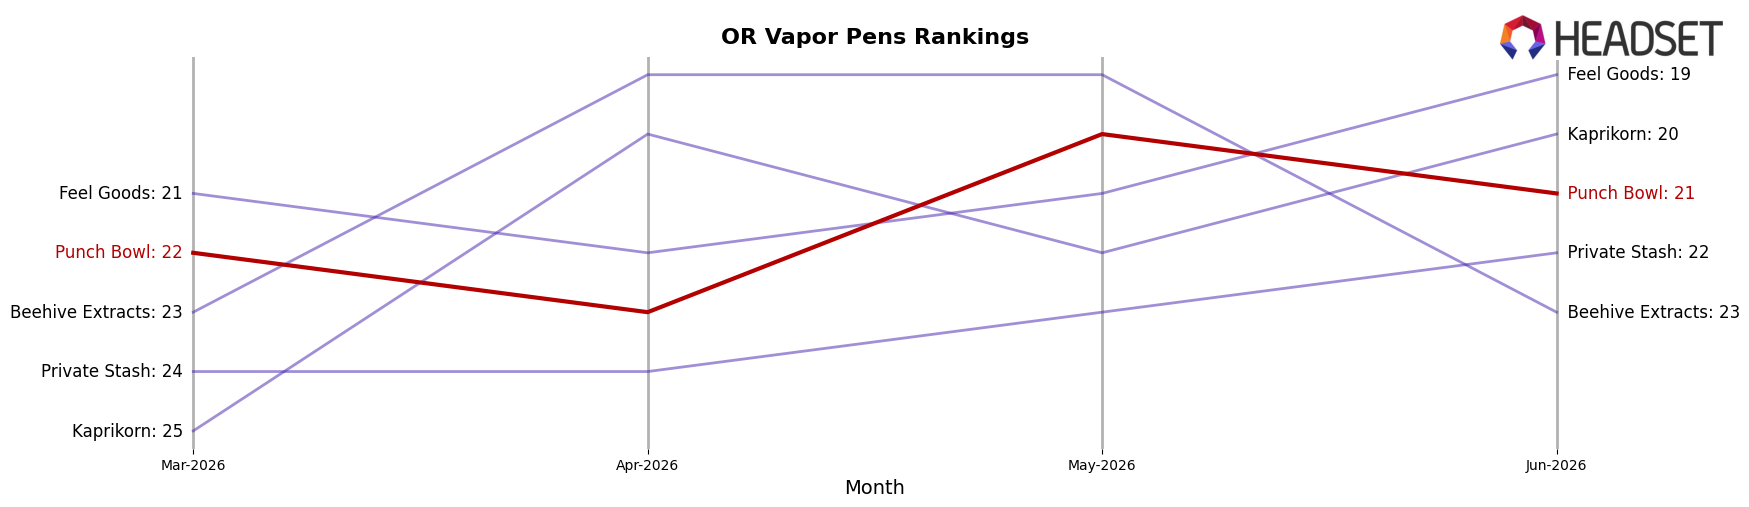
Punch Bowl sits at rank #21 in OR Vapor Pens for June 2026, improving 9 spots from #30 year over year, after touching a peak of #20 in May 2026 and slipping 1 position from #20 to #21 over the last month; this contrasts with Buddies holding #1 after rising from #2 and FRESHY jumping from #5 to #2 with 81.5% YoY sales growth, while Entourage Cannabis / CBDiscovery fell from #1 to #3 alongside a 38.9% YoY sales decline. Despite a 1-rank dip from May 2026 to June 2026 and only a 1-position gap from its all-time best at #20, the 9-spot YoY climb alongside competitors’ divergent moves implies Punch Bowl’s trajectory is stabilization in the low-20s unless it converts short-term peaks into sustained share gains.
Notable Products
Maui Wowie Flavored Distillate Cartridge (1g) posted the largest movement in June 2026 with a +100.5% month-over-month surge to rank 1, while Maui Wowie Flavored Distillate Disposable (1g) fell -52.2% to rank 8. Key Lime Pie Flavored Distillate Cartridge (1g) slipped -9.3% at rank 4, and Oregon Marionberry Distillate Cartridge (1g) dropped -26.6% at rank 5. Eight of the top ten are Vapor Pens SKUs, and this concentration, paired with a top-heavy rise for a single cartridge and a steep drop for its Disposable counterpart, implies Punch Bowl is pivoting mix toward refillable cartridges and away from single-use formats.
Top Selling Cannabis Brands
Data for this report comes from real-time sales reporting by participating cannabis retailers via their point-of-sale systems, which are linked up with Headset’s business intelligence software. Headset’s data is very reliable, as it comes digitally direct from our partner retailers. However, the potential does exist for misreporting in the instance of duplicates, incorrectly classified products, inaccurate entry of products into point-of-sale systems, or even simple human error at the point of purchase. Thus, there is a slight margin of error to consider. Brands listed on this page are ranked in the top twenty within the market and product category by total retail sales volume.

