Jun-2026
Sales
Trend
6-Month
Product Count
SKUs
Avg Price
YoY Sales Change
YoY Price Change
Market Insights Snapshot
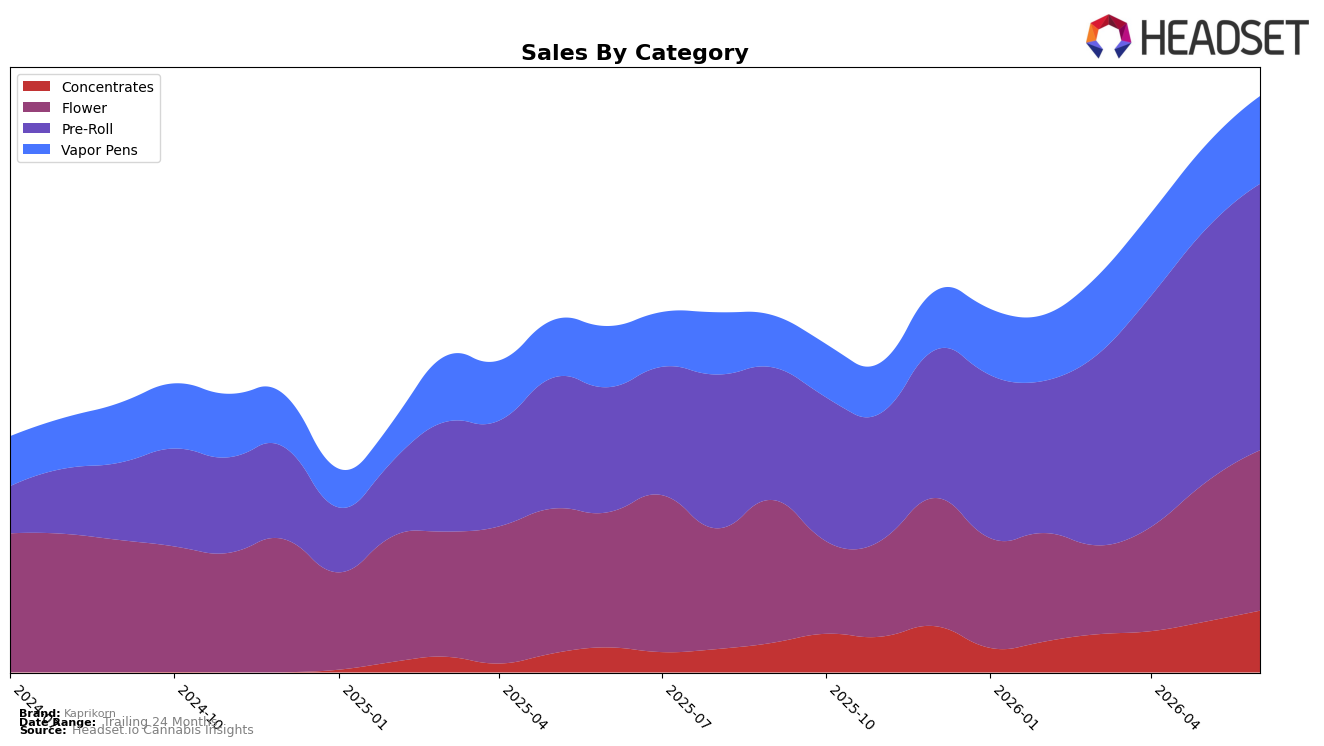
Kaprikorn’s category mix in June 2026 is anchored by Pre-Roll at 46.26% share with 113.36% year-over-year growth and 5.41% month-over-month growth, while Flower holds 27.83% share with 18.64% year-over-year and 15.78% month-over-month growth. Vapor Pens contribute 15.21% share with 43.75% year-over-year and 4.48% month-over-month growth, and Concentrates account for 10.70% share with 147.81% year-over-year and 22.06% month-over-month growth. Against this mix, brand sales rose 66.56% year over year and the average price fell 10.58%, and in Oregon Pre-Roll sits at rank 2; the pattern implies Kaprikorn is trading volume expansion in Pre-Roll and Concentrates for price-led accessibility, using Flower’s double-digit month-over-month uptick as the ballast to sustain the portfolio.
The shifts imply a positioning tilt toward value-led entry points that convert repeat volume in Pre-Roll and recruit high-potency shoppers via Concentrates, with rank 2 in Pre-Roll in Oregon signaling competitive headroom while average price at $16.07 and a 10.58% year-over-year price decline set the threshold for basket-friendly trial. With Concentrates’ 22.06% month-over-month acceleration alongside Flower’s 15.78% month-over-month gain, and Vapor Pens growing 4.48% month over month against 43.75% year over year, the portfolio balance suggests Kaprikorn can defend share with Pre-Roll scale (46.26% mix) while concentrating incremental investment where momentum is steepest to convert June 2026 mix gains into durable rank improvement.
Competitive Landscape
Kaprikorn sits at #2 in Oregon Pre-Roll in June 2026, up three spots from #5 year over year, and one spot ahead of its March 2026 position of #3; this matches its peak rank of #2 in June 2026 and places it directly behind STiCKS, which moved from #2 to #1 while expanding sales by 164.98% year over year. Meanwhile, Hellavated slid from #1 to #3 despite 15.90% YoY sales growth, and Portland Heights fell from #3 to #4 with a 26.34% YoY sales decline, signaling that Kaprikorn’s upward rank shift is tied to displacement at the top rather than broad market lift; the trajectory implies Kaprikorn is positioned to contest #1 if it can convert proximity at #2 and a three-rank YoY climb into share gains against a faster-growing category leader.

Notable Products
Mac n' Jack Pre-Roll 2-Pack (1.5g) posted the steepest movement with a -12.8% month-over-month decline while still holding rank 7, signaling elasticity pressure in mid-table pre-rolls even as rank stability masks unit softness. In contrast, Tropicanna Cherries Pre-Roll 2-Pack (1.5g) rose 9.0% MoM at rank 6, tightening spread against ranks 4 and 5 where multi-pack formats concentrate volume at $49,534 for The Bridge x Melted Strawberries Pre-Roll 10-Pack (5g). Four of the top ten are 10-Pack Pre-Roll SKUs and six are 2-Pack Pre-Roll SKUs, and pre-rolls occupy ranks 1 through 10 except for Mule Fuel (Bulk) at rank 2, implying a portfolio skew toward convenience formats where small MoM shifts can reallocate share across adjacent ranks. The pattern implies Kaprikorn is consolidating around pre-roll dominance with multi-pack anchors and a few 2-Pack climbers, indicating a trading-up pathway that could convert rank stability into higher per-basket yield despite isolated declines.
Top Selling Cannabis Brands
Data for this report comes from real-time sales reporting by participating cannabis retailers via their point-of-sale systems, which are linked up with Headset’s business intelligence software. Headset’s data is very reliable, as it comes digitally direct from our partner retailers. However, the potential does exist for misreporting in the instance of duplicates, incorrectly classified products, inaccurate entry of products into point-of-sale systems, or even simple human error at the point of purchase. Thus, there is a slight margin of error to consider. Brands listed on this page are ranked in the top twenty within the market and product category by total retail sales volume.

