Jun-2026
Sales
Trend
6-Month
Product Count
SKUs
Avg Price
YoY Sales Change
YoY Price Change
Market Insights Snapshot
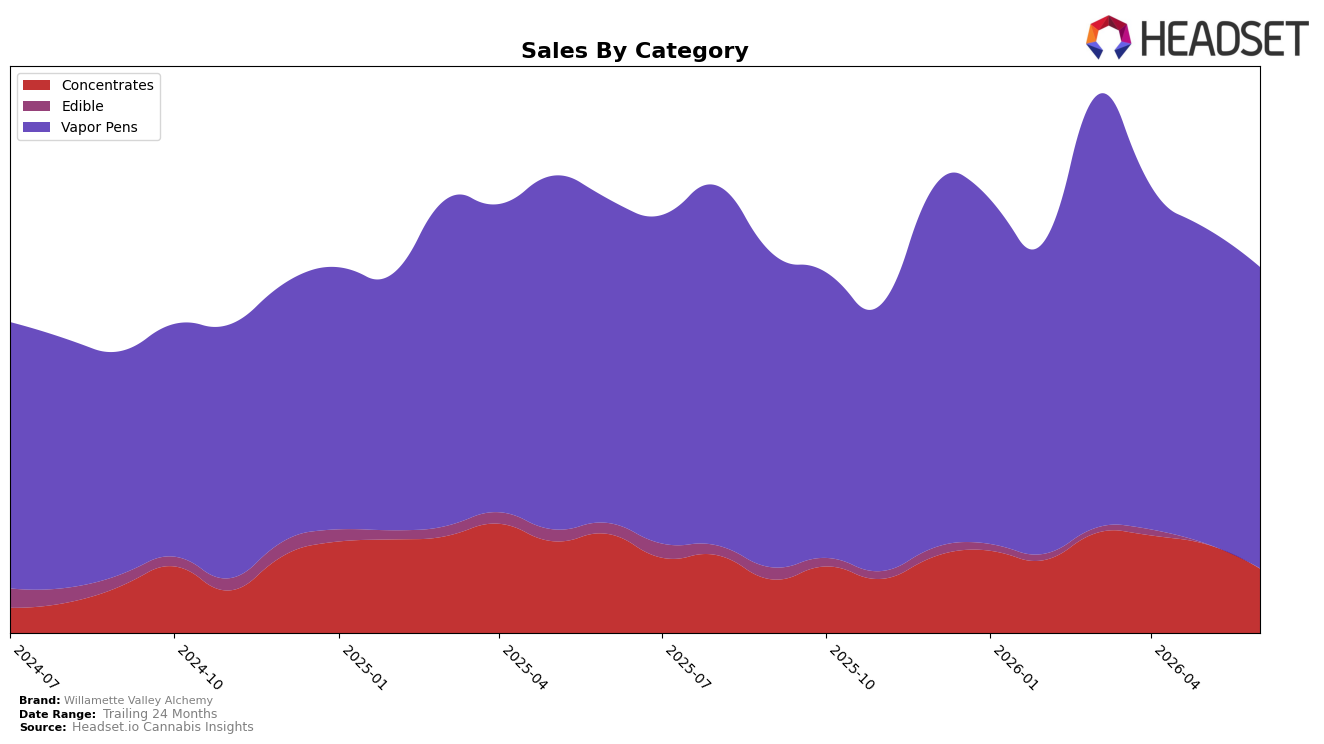
In June 2026, Willamette Valley Alchemy’s category mix concentrated 81.03% of sales in Vapor Pens with a month-over-month decline of 4.47% and a year-over-year decline of 6.96%, while Concentrates held 17.99% share with steeper month-over-month contraction of 26.91% and a year-over-year drop of 33.92%. Edible accounted for just 0.98% share with a 6.30% month-over-month decline and a 74.09% year-over-year decline, leaving the average price down 4.07% year over year to $21.29 despite Vapor Pens pricing near $23.17. The pattern implies mix compression toward Vapor Pens amid broad declines, with downside amplified by accelerated pullbacks in Concentrates and Edible that are unlikely to offset the brand’s overall 15.33% year-over-year sales contraction.
Within Oregon Vapor Pens, a rank of 25 alongside an 81.03% category reliance and a 4.47% month-over-month decline indicates that incremental share defense must come from stabilizing the lead category rather than banking on sub-1% Edible or a 17.99% Concentrates base that fell 26.91% month over month. Given a 10.75% 24‑month sales gain and a 6.96% year-over-year decline in the anchor category, the brand’s positioning tilts toward defending mid-pack visibility in Vapor Pens while using price at a 4.07% year-over-year discount to sustain velocity, because diversification levers contributed disproportionately to the year-over-year drag.
Competitive Landscape
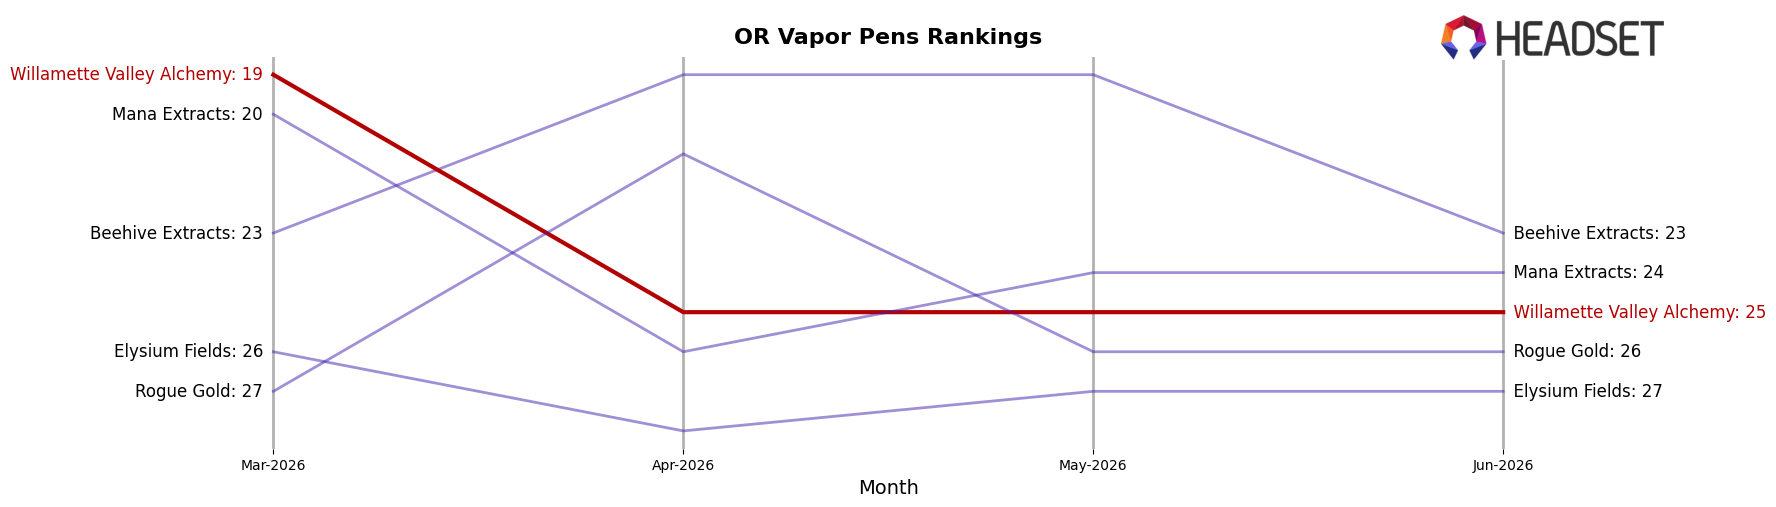
Willamette Valley Alchemy sits at rank #25 in OR Vapor Pens for June 2026, unchanged year over year from #25, after sliding 6 positions from #19 in March 2026 to #25 by June 2026; that 0-position YoY hold alongside a 6-rank quarter-over-quarter drop signals a stall after a brief peak. In contrast, Buddies moved from #2 to #1 while growing sales 16.9% year over year, and FRESHY climbed from #5 to #2 with an 81.5% YoY sales increase, whereas Entourage Cannabis / CBDiscovery fell from #1 to #3 amid a 38.9% YoY sales decline; relative to these moves, holding #25 while dropping 6 ranks since March 2026 implies Willamette Valley Alchemy is losing velocity against faster-rising peers and needs a targeted share recapture plan in high-growth subsegments.
Notable Products
Forbidden Fruit Liquid Live Resin Cartridge (1g) posted the steepest decline at -57.0% month over month and sat at rank 9, while Strawberry Fortune Liquid Live Resin Distillate Cartridge (1g) also dropped -32.5% at rank 9; in contrast, Pineapple Squirt Liquid Live Resin Cartridge (1g) surged +57.3% to rank 3. With Vapor Pens occupying 8 of the top 10 ranks and the top two slots held by cartridges, the mix points to a pivot toward liquid resin pens as the commercial core, even as underperformers at rank 9 signal active pruning within the long tail.
Top Selling Cannabis Brands
Data for this report comes from real-time sales reporting by participating cannabis retailers via their point-of-sale systems, which are linked up with Headset’s business intelligence software. Headset’s data is very reliable, as it comes digitally direct from our partner retailers. However, the potential does exist for misreporting in the instance of duplicates, incorrectly classified products, inaccurate entry of products into point-of-sale systems, or even simple human error at the point of purchase. Thus, there is a slight margin of error to consider. Brands listed on this page are ranked in the top twenty within the market and product category by total retail sales volume.

