.svg)
Sep-2026
Sales
Trend
6-Month
Product Count
SKUs
Avg Price
YoY Sales Change
YoY Price Change


Where to Buy
Pure Edibles is stocked at 50 licensed dispensaries across Arizona, with the deepest coverage in Phoenix, Tucson, Mesa, Tempe, and Apache Junction. Search by ZIP code or city below to find the closest one.
Market Insights Snapshot
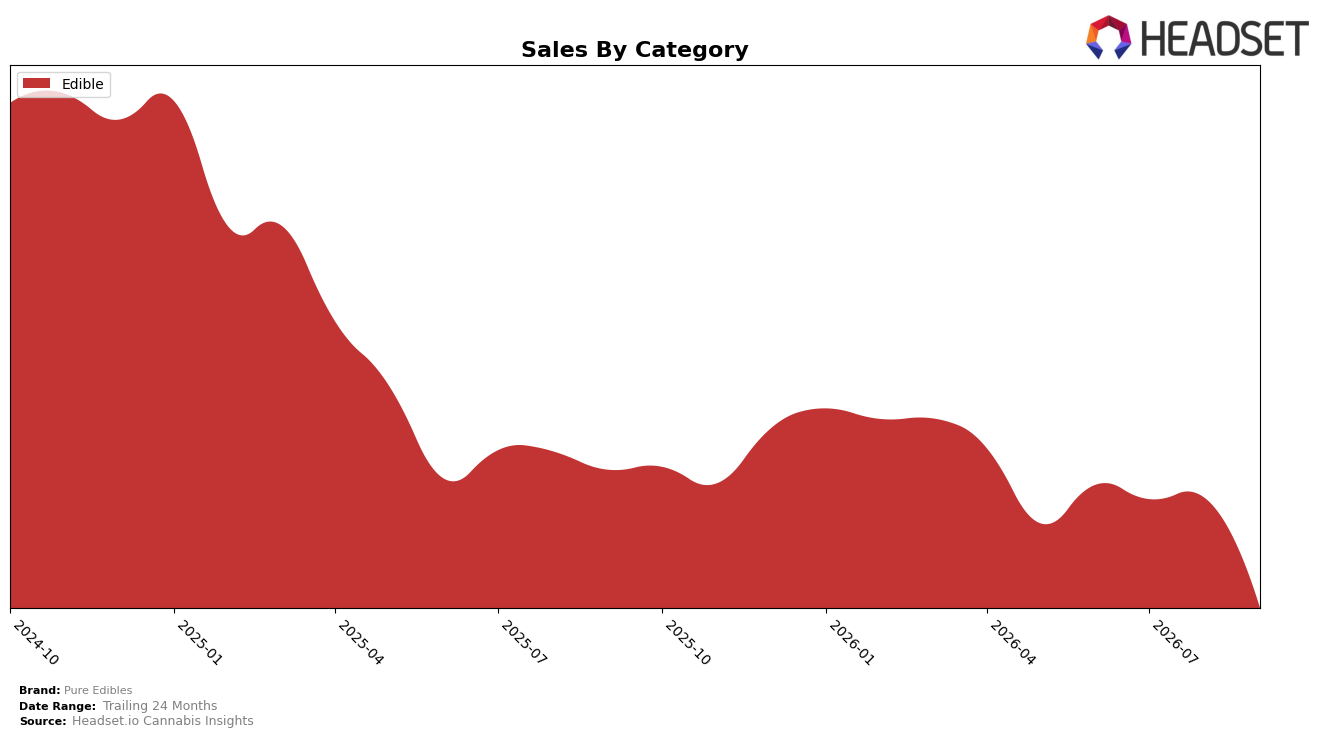
Pure Edibles operated as a single-category brand in September 2026, with Edible accounting for 100.0% of sales and a year-over-year decline of 27.8% alongside a month-over-month drop of 23.5%. The brand’s average price fell 13.0% year over year to $9.19, while overall brand sales declined 27.8% YoY, indicating price compression outpaced unit resilience; within the Edible category in Arizona, the brand ranked 12th, a position that aligns with both the 24-month sales contraction of 58.0% and the single-category exposure at 100.0% share. The implication is that a one-category portfolio magnifies the impact of price and velocity shifts; with all sales concentrated in Edible and rank at 12, maintaining or gaining distribution requires countering both the 23.5% MoM pullback and the 27.8% YoY contraction through mix tactics within the Edible segment rather than cross-category diversification.
The September 2026 mix indicates a trade-off between price cuts and demand capture: a 13.0% YoY price reduction coincided with a 27.8% YoY sales decline and a 23.5% MoM slide, implying that current discount depth is not converting into sufficient unit lift, while the 12th-place rank in Arizona sets a ceiling on shelf visibility. This pattern suggests the brand’s positioning is skewed toward price-reactive rather than differentiation-led, and that reclaiming share likely requires re-tiering SKUs within Edible (e.g., value vs. premium) to raise realized price or velocity by mix, since the 58.0% 24-month decline and 100.0% category concentration limit buffer against future price moves.
Competitive Landscape
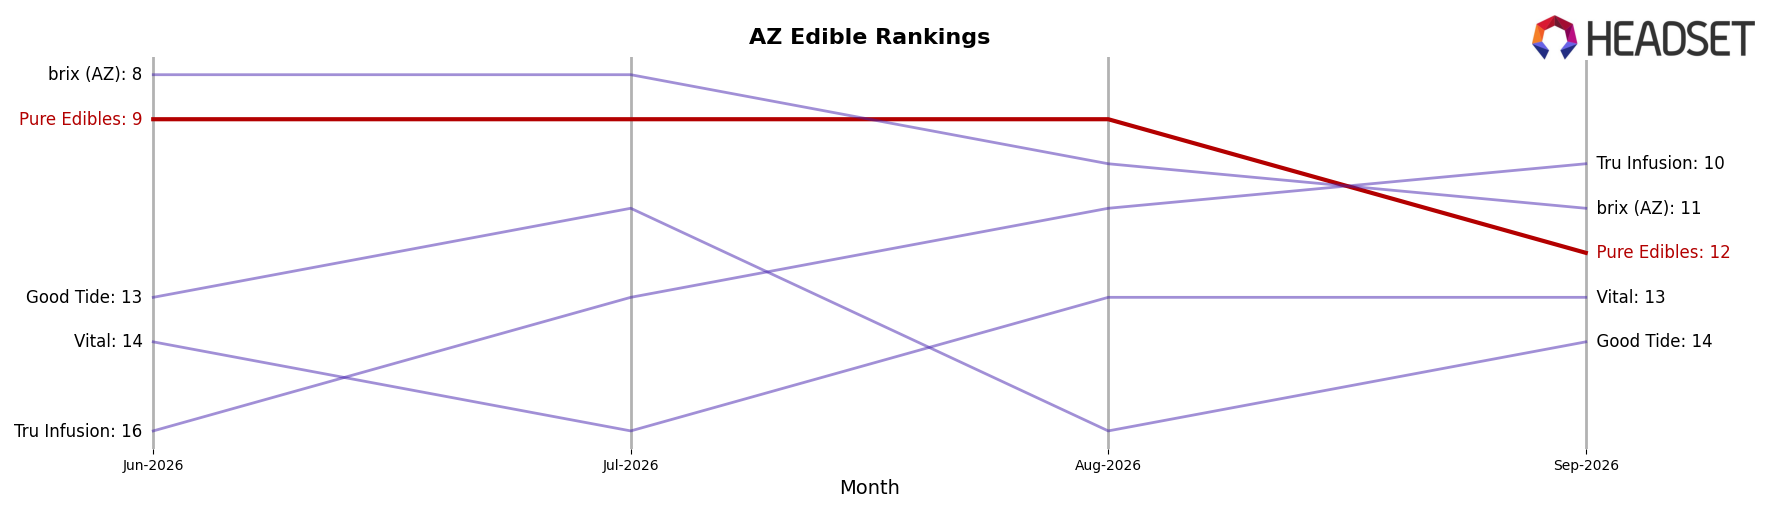
Pure Edibles sits at rank #12 in AZ Edible in September 2026, down 5 positions year over year from #7, and 3 spots below its June 2026 rank of #9; the brand’s peak of #7 in September 2025 now stands 5 ranks higher than its current position, pointing to a multi-quarter slide. Meanwhile, Wyld holds #1 despite a -16.2% year-over-year sales change, and Baked Bros moved up from #4 to #2 with +22.5% year-over-year growth, indicating that Pure Edibles’ rank loss is less about category contraction and more about share being taken by ascending rivals. The trajectory implies that without a shift in mix or activation, Pure Edibles is likely to cede further rank to competitors that are converting growth into higher placements.
Notable Products
Sativa Watermelon Gummies 10-Pack (100mg) posted the steepest decline at -38.6% month over month in September 2026, sliding to rank 5 while Sativa Fruit Punch Gummies 10-Pack (100mg) dropped -32.0% to rank 3. THC/CBN 2:1 Indica Berry Sleepy Gummies 10-Pack (100mg THC, 50mg CBN) held rank 1 despite a -7.7% dip and generated about $30,340, while Indica Watermelon Gummies 10-Pack (100mg) fell -21.4% to rank 2. With all top-10 items in Edible and multiple SKUs across Sativa and Indica fruit gummies showing double-digit declines, the mix points to seasonal softness in flavor-led gummies and a relative shift toward functional sleep formats anchoring the lineup.
Top Selling Cannabis Brands






Data for this report comes from real-time sales reporting by participating cannabis retailers via their point-of-sale systems, which are linked up with Headset’s business intelligence software. Headset’s data is very reliable, as it comes digitally direct from our partner retailers. However, the potential does exist for misreporting in the instance of duplicates, incorrectly classified products, inaccurate entry of products into point-of-sale systems, or even simple human error at the point of purchase. Thus, there is a slight margin of error to consider. Brands listed on this page are ranked in the top twenty within the market and product category by total retail sales volume.

