.svg)


Where to Buy
brix (AZ) is stocked at 11 licensed dispensaries across Arizona, with the deepest coverage in Tucson, Tempe, Phoenix, Safford, and Scottsdale. Search by ZIP code or city below to find the closest one.
Market Insights Snapshot
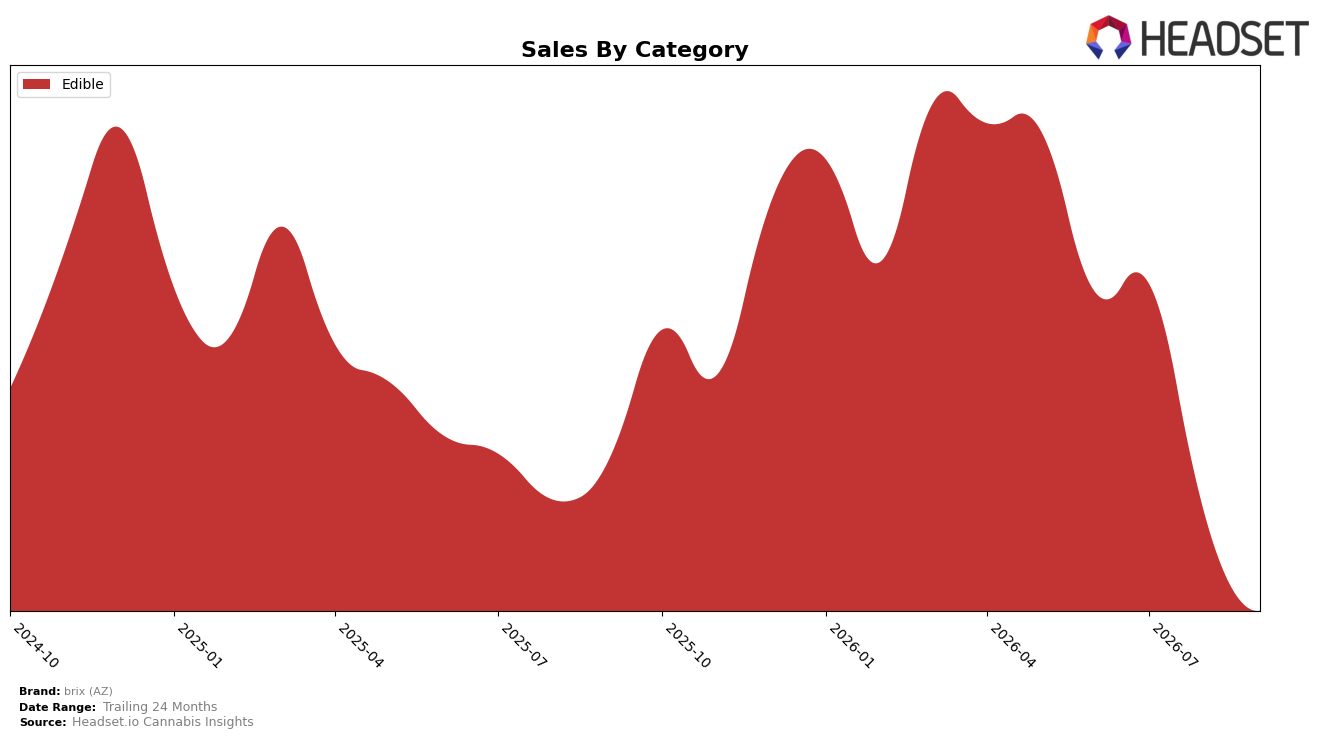
In September 2026, brix (AZ) operated as a single-category brand with Edible at 100.0% mix, posting a year-over-year decline of 19.9% alongside a month-over-month drop of 13.8%. The average price fell 20.7% YoY to $5.82, while overall brand sales were down 19.9% YoY, indicating unit volume was roughly flat to slightly positive despite a double-digit price reset. The brand held rank 11 within Edible in Arizona, and the combination of a 100.0% category concentration and a one-month contraction of 13.8% implies exposure to short-term category headwinds without the buffer of mix diversification.
The sharper 20.7% YoY price contraction versus a 19.9% YoY sales decline, paired with a 13.8% MoM sales dip, implies a price-led repositioning that has not yet translated into sustained unit or share gains at rank 11. Given Edible accounts for 100.0% of sales and average pricing declined faster than sales, the brand is trading down to protect throughput, which suggests near-term elasticity headroom is limited and the current price tier may be compressing margins without lifting rank. This pattern indicates that brix (AZ) is positioned as a value-leaning Edible player in Arizona whose immediate path to improved rank likely depends more on mix architecture (e.g., pack sizes or subformat focus within Edible) than further price cuts.
Competitive Landscape
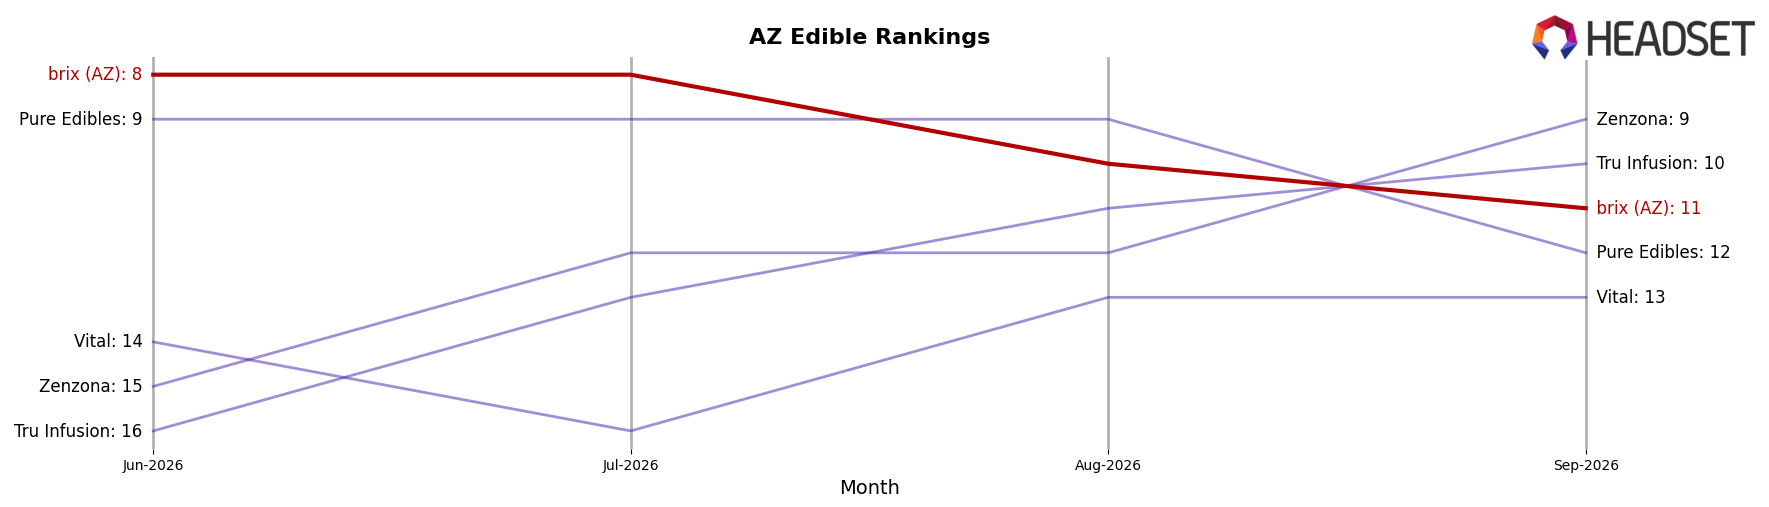
brix (AZ) sits at rank #11 in AZ Edible in September 2026, down 2 positions from #9 a year earlier, after sliding 3 spots from #8 in June 2026 to #11 in September 2026; the brand also trails its April 2026 peak at #7 by 4 ranks. Against this backdrop, Wyld held #1 year over year with a -16.2% sales change while staying at the top, and Baked Bros advanced from #4 to #2 alongside a 22.5% YoY sales increase, indicating that stability or gains at the top are happening even amid declines for some leaders. This rank drift—down 2 YoY and 3 since June—implies brix (AZ) is ceding share to faster-moving competitors and will need mix or promo adjustments to arrest further slide.
Notable Products
Strawberry Watermelon Big Dose Gummies 2-Pack (1000mg) posted the steepest decline at -24.5% month over month and sat at rank 7, while Golden Berry High Dose Gummies 2-Pack (1000mg) fell even harder at -42.7% to rank 8; this double hit at the high-dose tier suggests a retreat from bulk-potency demand in September 2026. At the top, Strawberry Watermelon Gummy (100mg) held rank 1 despite a -18.6% slide, and Blueberry Pomegranate Gummy (100mg) stayed at rank 2 with -13.9%, indicating that volume concentrates in standard-dose gummies even as growth cools. Four of the top ten are in the Strawberry/Blueberry/Golden/Blackberry fruit gummy family, and Blackberry Raspberry Gummy (100mg) was the only riser at +2.9% at rank 4, signaling shoppers are trading back to familiar 100mg formats over experimental or high-dose packs. The pattern implies brix (AZ) will need to lean into core 100mg SKUs for dependable velocity while reevaluating pricing and pack architecture for 1000mg variants to stem share erosion.
Top Selling Cannabis Brands






Data for this report comes from real-time sales reporting by participating cannabis retailers via their point-of-sale systems, which are linked up with Headset’s business intelligence software. Headset’s data is very reliable, as it comes digitally direct from our partner retailers. However, the potential does exist for misreporting in the instance of duplicates, incorrectly classified products, inaccurate entry of products into point-of-sale systems, or even simple human error at the point of purchase. Thus, there is a slight margin of error to consider. Brands listed on this page are ranked in the top twenty within the market and product category by total retail sales volume.

