.svg)

Jul-2026
Sales
Trend
6-Month
Product Count
SKUs
Avg Price
YoY Sales Change
YoY Price Change


Market Insights Snapshot
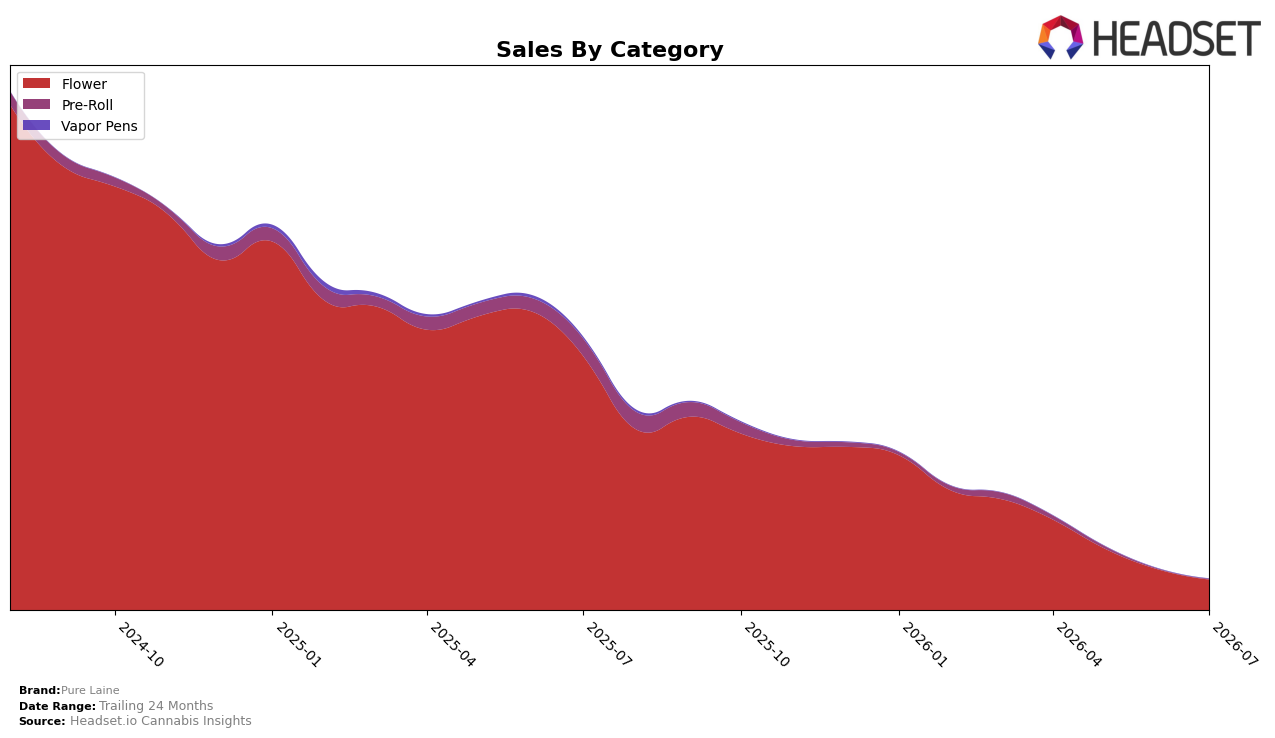
In July 2026, Pure Laine concentrated 99.10% of sales in Flower while Pre-Roll held 0.90%, with Flower down 88.09% year over year and 25.19% month over month, and Pre-Roll down 98.37% year over year and 26.63% month over month. The average price climbed 86.56% year over year to $74.07 while Flower’s category share dominance coincided with a category rank of 48 in Flower in Saskatchewan, indicating that the brand is trading fewer units at higher prices and ceding velocity despite near-total mix concentration.
The mix tilt toward Flower at 99.10% alongside dual contractions of 25.19% month over month and 88.09% year over year implies Pure Laine is overexposed to a single category where its current pricing strategy limits unit throughput. With Pre-Roll at just 0.90% share and falling 26.63% month over month while the overall brand price rose 86.56% year over year, the pattern suggests repositioning pressure: diversify into lower-ticket formats or recalibrate Flower price tiers to restore rank headroom around position 48 and stabilize share against ongoing month-over-month declines.
Competitive Landscape
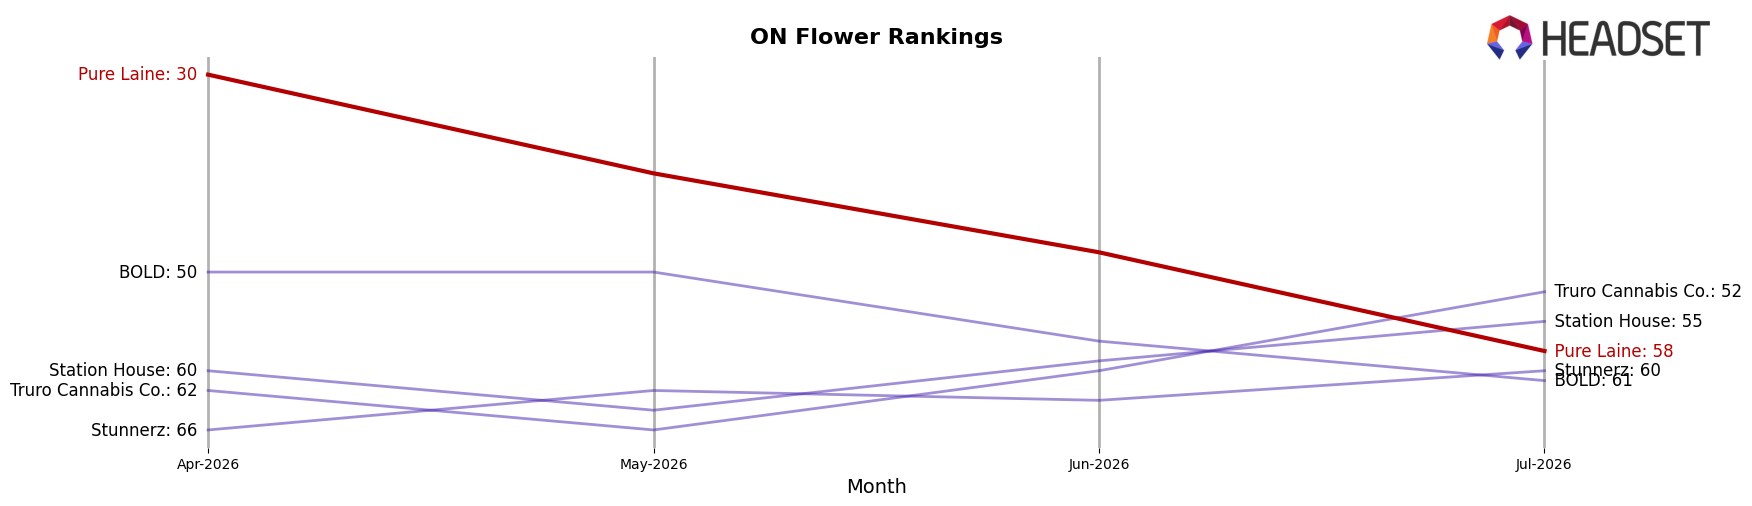
Pure Laine sits at rank #58 in ON Flower in July 2026, down 42 places year over year from #16 and 28 places since April 2026 when it was #30, while the brand’s peak was #3 in July 2024. In contrast, Shred advanced year over year from #2 to #1 with sales up 17.23%, and Spinach climbed from #4 to #2 with a 31.07% sales increase, whereas Back Forty / Back 40 Cannabis slipped from #1 to #4 alongside a 5.44% sales decline. The juxtaposition of Pure Laine’s 42-rank YoY drop against competitors moving up the top five suggests share is consolidating at the top, and the brand’s trajectory from a #3 peak to #58 implies a need to reposition toward larger-volume segments where momentum has concentrated.
Notable Products
Original Kush (3.5g) posted the steepest decline in July 2026 at -63.6% MoM while dropping to rank 4, and Special Haze (14g) fell -72.3% MoM from the top 10’s mid-pack to a tie at rank 7; together these moves indicate deep retrenchment in formerly durable mid-size Flower formats. Big Pleasures (28g) held rank 1 despite a -19.2% MoM dip and accounted for the bulk of category dollars with about $174,175, while Special Haze (3.5g) slid -52.8% to rank 2; the concentration of eight of the top ten in Flower suggests a reliance on a single category that is absorbing synchronized declines rather than offsetting them with Pre-Rolls. With Super Skunk (3.5g) at -51.3% MoM in rank 3 alongside Super Skunk (14g) at -37.6% in a rank-7 tie, and Little Pleasures (7g) at -23.1% in rank 6, the portfolio’s weight in 3.5g–14g sizes is underperforming while the 28g anchor defends share, implying Pure Laine needs either price-pack architecture changes or mix diversification to stabilize volume.
Top Selling Cannabis Brands






Data for this report comes from real-time sales reporting by participating cannabis retailers via their point-of-sale systems, which are linked up with Headset’s business intelligence software. Headset’s data is very reliable, as it comes digitally direct from our partner retailers. However, the potential does exist for misreporting in the instance of duplicates, incorrectly classified products, inaccurate entry of products into point-of-sale systems, or even simple human error at the point of purchase. Thus, there is a slight margin of error to consider. Brands listed on this page are ranked in the top twenty within the market and product category by total retail sales volume.

