Jun-2026
Sales
Trend
6-Month
Product Count
SKUs
Avg Price
YoY Sales Change
YoY Price Change
Market Insights Snapshot
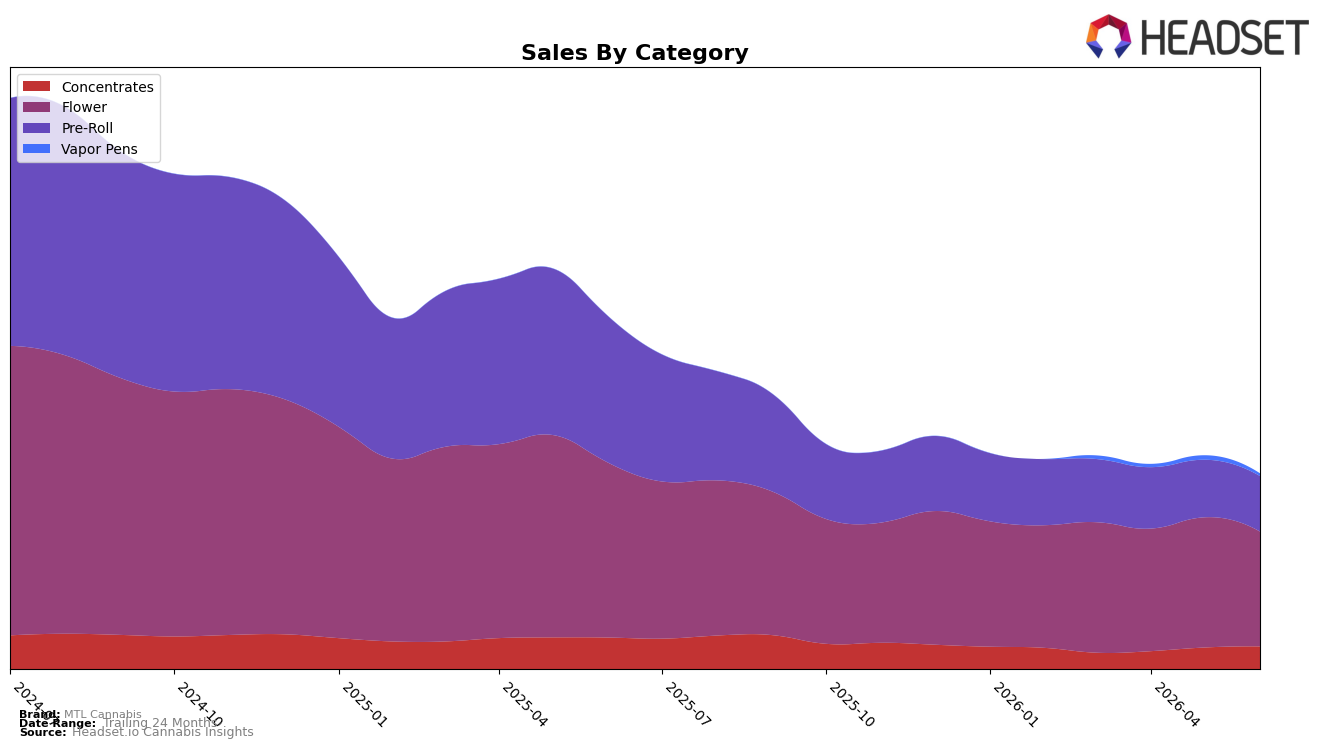
In June 2026, MTL Cannabis concentrated 58.78% of sales in Flower with a year-over-year decline of 34.38% and a month-over-month drop of 11.85%, while Pre-Roll held 28.35% share but contracted more sharply at 62.21% YoY and 3.55% MoM. Concentrates expanded to 11.61% share with sales up 5.21% MoM despite a 28.10% YoY decrease, and Vapor Pens slipped to 1.27% share with a 41.57% MoM decline and no reported YoY baseline; the average price rose 11.15% YoY to $32.14. The pattern implies the brand is leaning more on Flower stability and a recovering Concentrates pocket to offset steeper Pre-Roll erosion, creating a mix shift toward higher-price formats even as total sales fell 44.67% YoY.
These shifts reposition MTL Cannabis toward fewer but potentially higher-value baskets as Flower keeps scale at 58.78% share and Concentrates adds incremental resiliency with 5.21% MoM growth, while a 62.21% YoY slide in Pre-Roll reduces entry-level throughput. With Ontario leadership at stake via a Flower category rank of 16 and a concurrent 11.15% YoY increase in average price, the portfolio tilt suggests prioritizing margin defense and depth in core SKUs over breadth, implying that recapturing rank will depend on stabilizing Pre-Roll volumes without diluting price while nurturing the Concentrates uptick.
Competitive Landscape
MTL Cannabis sits at rank #16 in ON Flower in June 2026, a 1-position improvement from rank #17 year over year, while holding flat versus March 2026 at #17 and still trailing its peak of #9 from August 2024; meanwhile, Spinach climbed from #4 to #1 with a 38.3% year-over-year sales increase and Back Forty / Back 40 Cannabis slipped from #1 to #4 alongside an 11.3% sales decline, indicating that MTL Cannabis’s marginal rank gain amid leadership reshuffles suggests a stable foothold but limited share capture against faster-moving leaders.

Notable Products
The steepest decline came from Sage N' Sour Pre-Roll 3-Pack (1.5g), down 40.6% month over month while holding rank 1, as Sage N Sour (3.5g) fell 11.1% at rank 2, indicating that flagship Sage SKUs lost velocity at the very top even as they maintained placement. In contrast, Jungl' Cake Pre-Roll 3-Pack (1.5g) gained 16.6% and sat at rank 7, while West Coast Kush (3.5g) in Flower inched up 3.5% at rank 3, and four of the top ten are Pre-Roll SKUs spanning ranks 1, 4, 7, and 9. Concentrates were mixed, with Wes' Coast Kush Hash (2g) nearly flat at -0.8% at rank 5 while Sage n' Sour Hash (2g) rose 12.1% at rank 6, and Wes' Coast Kush (14g) entered the top ten at rank 10 with $176,592 in June 2026. The pattern implies a pivot toward breadth across formats where Pre-Rolls and select Concentrates carry share despite volatility in Sage-led items, suggesting portfolio balance is offsetting softness in the lead Pre-Roll.
Top Selling Cannabis Brands
Data for this report comes from real-time sales reporting by participating cannabis retailers via their point-of-sale systems, which are linked up with Headset’s business intelligence software. Headset’s data is very reliable, as it comes digitally direct from our partner retailers. However, the potential does exist for misreporting in the instance of duplicates, incorrectly classified products, inaccurate entry of products into point-of-sale systems, or even simple human error at the point of purchase. Thus, there is a slight margin of error to consider. Brands listed on this page are ranked in the top twenty within the market and product category by total retail sales volume.

