Jun-2026
Sales
Trend
6-Month
Product Count
SKUs
Avg Price
YoY Sales Change
YoY Price Change
Market Insights Snapshot
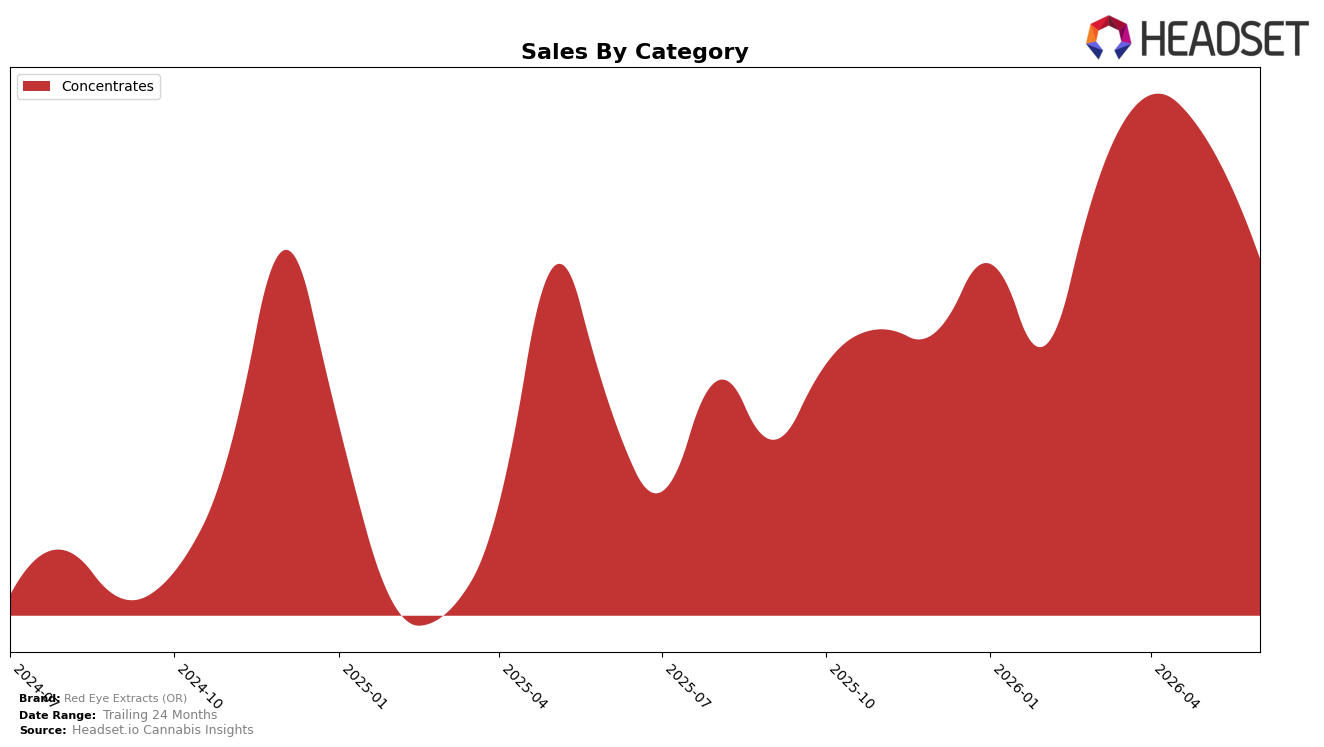
In June 2026, Red Eye Extracts (OR) operated as a single-category brand with Concentrates at 100.0% of sales share, pairing 18.9% year-over-year sales growth with an 12.0% month-over-month decline, while average price decreased 1.3% year-over-year alongside a full mix concentration that left no buffer from other categories. With rank 3 in Concentrates in Oregon and a 121.0% sales gain over 24 months, the combination of a tighter price (-1.3% YoY) and a June pullback (-12.0% MoM) implies that June’s softness is timing- or promo-driven rather than structural share loss within the brand’s own mix, because there is no intra-brand category migration to dilute its position.
The unchanged 100.0% mix in Concentrates, combined with rank 3 in Oregon and 18.9% year-over-year growth, positions the brand as a category specialist whose performance hinges on depth, not breadth. The 12.0% month-over-month decline against a 1.3% year-over-year price decrease signals reliance on volume cadence within Concentrates rather than price-led expansion, suggesting that defending rank 3 will require reinforcing repeat and seasonal peaks within this single lane instead of diversifying into adjacent categories.
Competitive Landscape
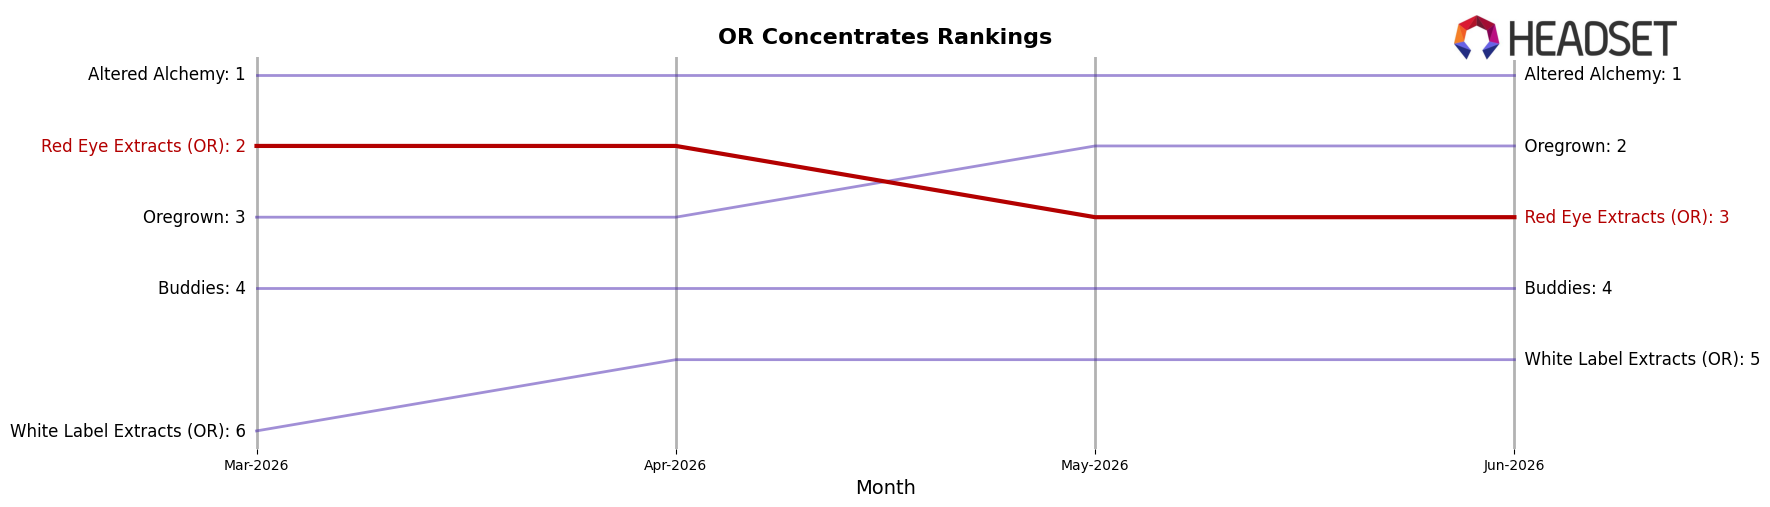
Red Eye Extracts (OR) sits at rank #3 in Oregon Concentrates in June 2026, down 1 position year over year from #2 but also down 1 from its April 2026 peak of #2; alongside this rank slippage, the brand moved from #2 three months ago to #3 now, signaling a 1-place retreat within the quarter. In contrast, Oregrown climbed from #3 year over year to #2 currently while expanding sales by 153.4%, and Buddies advanced from #8 to #4 with 77.1% YoY growth, whereas category leader Altered Alchemy held #1 despite a 9.7% YoY sales decline; this mix of upward competitor mobility and a 1-rank pullback for Red Eye Extracts (OR) implies the brand is ceding relative momentum and must convert proximity to the top tier into share gains to avoid further erosion.
Notable Products
Tea Time Cured Resin (1g) posted the largest month-over-month gain at +70.1% and jumped into rank 1 in June 2026, while Chem Sour Blueberry Snow Cured Resin (2g) fell -39.5% and slid to rank 4. Two other top-10 items logged double-digit declines or unknown momentum, and Bloof Cured Resin (2g) dropped -30.1% while holding rank 7. With every top-10 SKU in Concentrates and multiple 2g formats clustered between ranks 3 and 8, the mix points to a pivot toward breadth in cured resins where 1g spikes can offset volatility in larger formats.
Top Selling Cannabis Brands
Data for this report comes from real-time sales reporting by participating cannabis retailers via their point-of-sale systems, which are linked up with Headset’s business intelligence software. Headset’s data is very reliable, as it comes digitally direct from our partner retailers. However, the potential does exist for misreporting in the instance of duplicates, incorrectly classified products, inaccurate entry of products into point-of-sale systems, or even simple human error at the point of purchase. Thus, there is a slight margin of error to consider. Brands listed on this page are ranked in the top twenty within the market and product category by total retail sales volume.

