Jun-2026
Sales
Trend
6-Month
Product Count
SKUs
Avg Price
YoY Sales Change
YoY Price Change
Market Insights Snapshot
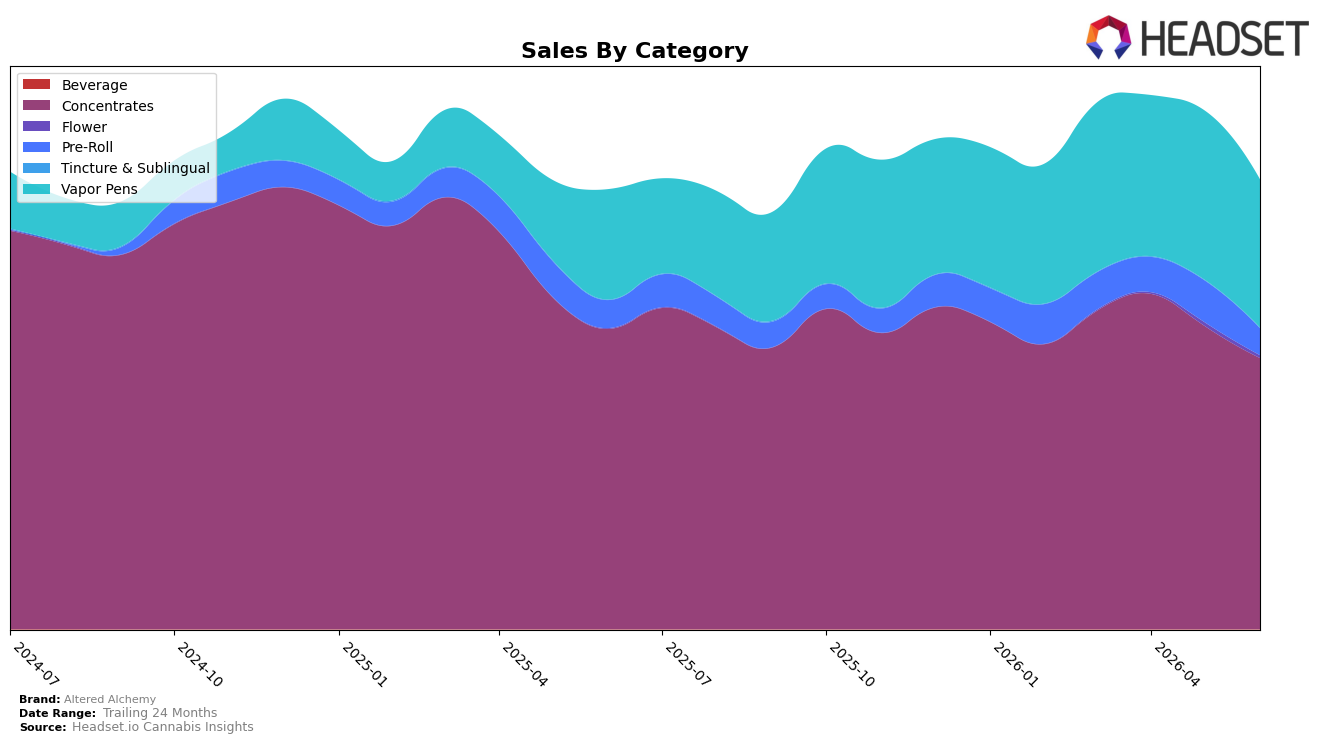
Altered Alchemy’s mix in June 2026 centered on Concentrates at 60.46% share with year-over-year decline of 9.70% and month-over-month decline of 10.60%, while Vapor Pens held 33.01% share with year-over-year growth of 34.46% but a month-over-month decline of 12.44%. Pre-Roll accounted for 5.93% share with year-over-year down 3.67% and month-over-month down 35.86%, and Flower, though just 0.54% share, posted a year-over-year rise of 432.88% against a month-over-month decline of 26.63%; Tincture & Sublingual remained niche at 0.05% share with year-over-year up 44.57% and month-over-month up 6.81%. With average price up 7.65% year-over-year while total brand sales rose 2.24% year-over-year and 24-month sales up 2.58%, the thesis is that a Concentrates-led portfolio is compressing volumes short-term while Vapor Pens’ faster year-over-year growth is preventing deeper share erosion.
Given a number 1 rank in Concentrates in Oregon alongside a 9.70% year-over-year decline and 10.60% month-over-month decline in that category, the positioning hinges on defending a lead segment that is shrinking faster month-over-month than the brand overall, while leaning into Vapor Pens’ 34.46% year-over-year growth despite a 12.44% month-over-month drop. The combination of Pre-Roll down 35.86% month-over-month and Flower’s 432.88% year-over-year surge from a 0.54% base suggests that peripheral categories are too small to offset Concentrates volatility, so the practical implication is to use pricing (up 7.65% year-over-year) and mix within Concentrates to stabilize rank while reallocating incremental effort to Vapor Pens to diversify reliance without meaningfully diluting margin in June 2026.
Competitive Landscape
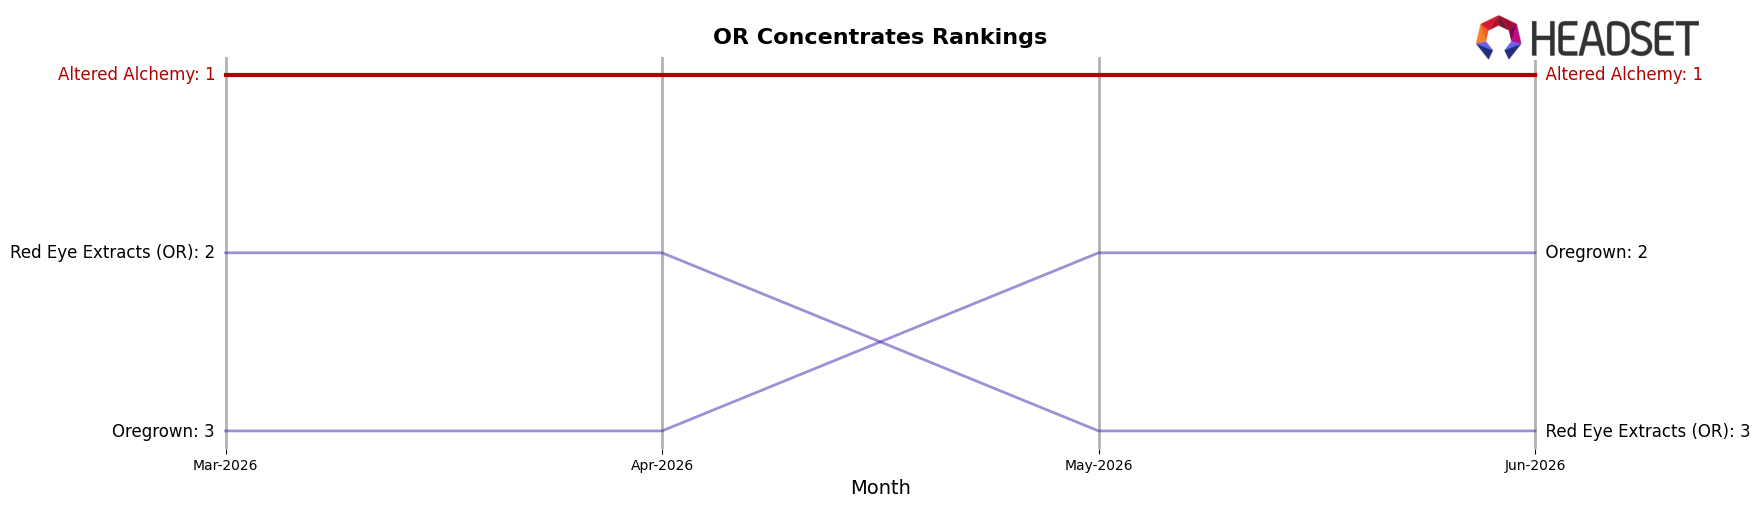
Altered Alchemy ranks #1 in Oregon Concentrates in June 2026, unchanged YoY from #1, while holding #1 for the past three months and peaking at #1 in June 2026; in contrast, Oregrown sits at #2 after improving from #3 YoY with 153.4% sales growth, and Red Eye Extracts (OR) has slid to #3 from #2 despite 18.9% sales growth—meanwhile, Buddies advanced to #4 from #8 with 77.1% growth as White Label Extracts (OR) dropped to #5 from #4 with a 2.6% decline—indicating Altered Alchemy’s flat rank at #1 masks rising competitive pressure from faster-climbing peers that could compress its lead if current trajectories persist.
Notable Products
Kush Mintz Cured Resin (1g) posted the steepest movement in June 2026 with a -40.6% month-over-month drop while holding rank 3, contrasting with Purple Cream Cured Resin (1g) up 21.1% at rank 1; this spread implies volatility is concentrating away from the leader toward mid-pack SKUs. Strawberry Drip Cured Resin (1g) rose 7.4% at rank 2, while Maui Jack Cured Resin (1g) fell -35.0% at rank 7, and four of the top ten are Concentrates SKUs clustered in ranks 1–4, suggesting momentum is polarized between the very top and the lower half. Zangria Cured Resin (1g) was effectively flat at +0.3% in rank 9, whereas Grape Fritter Cured Resin (1g) slid -35.5% in rank 10; the concentration of Cured Resin formats across all ten spots, anchored by a single leader at $33,565, points to a portfolio leaning on one flagship while the tail turns over. The pattern implies Altered Alchemy is consolidating share around a top Concentrates winner while pruning or refreshing weaker Cured Resin variants to stabilize ranks 6–10.
Top Selling Cannabis Brands
Data for this report comes from real-time sales reporting by participating cannabis retailers via their point-of-sale systems, which are linked up with Headset’s business intelligence software. Headset’s data is very reliable, as it comes digitally direct from our partner retailers. However, the potential does exist for misreporting in the instance of duplicates, incorrectly classified products, inaccurate entry of products into point-of-sale systems, or even simple human error at the point of purchase. Thus, there is a slight margin of error to consider. Brands listed on this page are ranked in the top twenty within the market and product category by total retail sales volume.

