Market Insights Snapshot
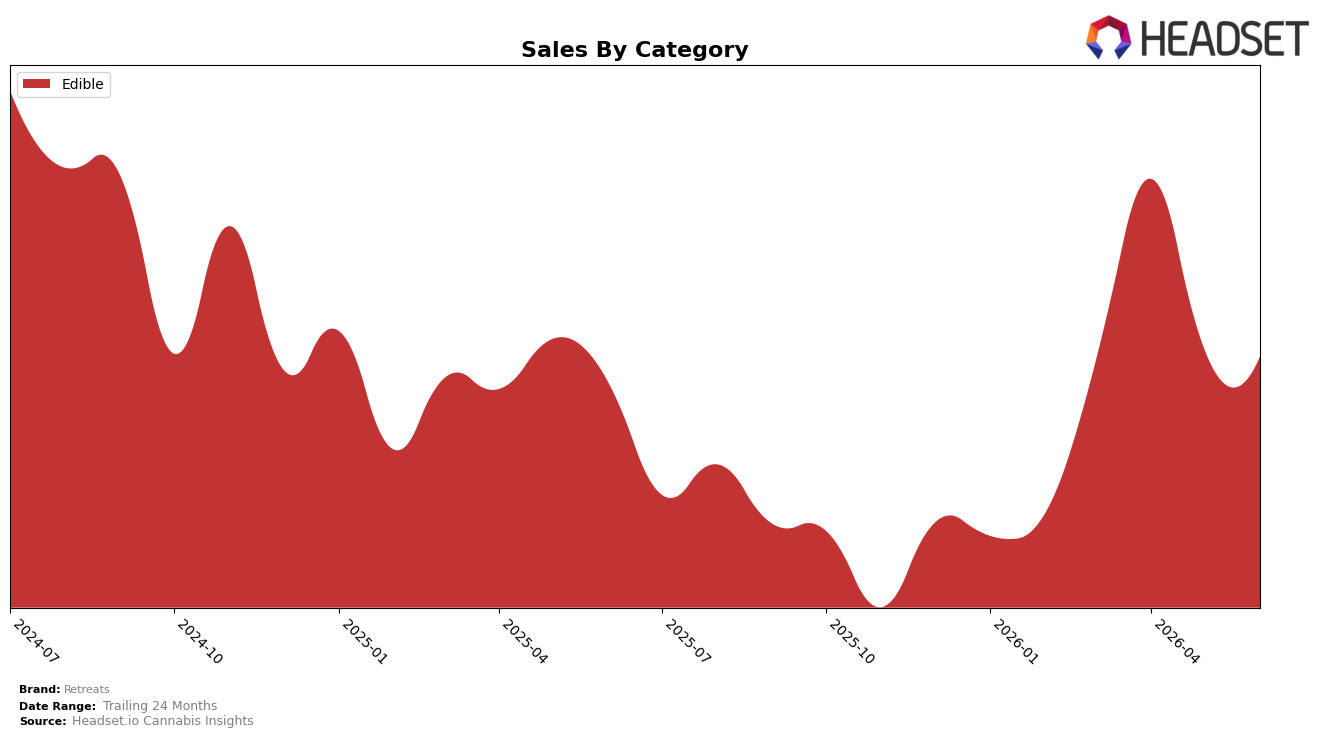
In June 2026, Retreats operated as a single-category brand with Edible at 100.0% of mix and a rank of 29 in Edible within Oregon. Year over year, sales in Edible rose 5.2% while average price fell 10.2%, and month over month sales dipped 1.2% alongside a flat 0.0 percentage-point shift in category share because the portfolio remains concentrated. The pattern implies Retreats is capturing volume gains within Edible despite price compression, but a sole-category focus limits cross-category insulation when monthly volatility like the 1.2% decline emerges.
With Edible fixed at 100.0% of sales and rank at 29, the 5.2% year-over-year growth paired with a 10.2% price decline indicates Retreats is trading down on price to defend or expand unit velocity, while the 1.2% month-over-month sales pullback exposes sensitivity to short-term demand shifts. The implication is positioning anchored in value within Edible: pricing is the primary lever, which can sustain volume-driven share maintenance at rank 29 in Oregon but constrains premium perception and leaves the brand reliant on discount elasticity rather than mix-led margin diversification.
Competitive Landscape
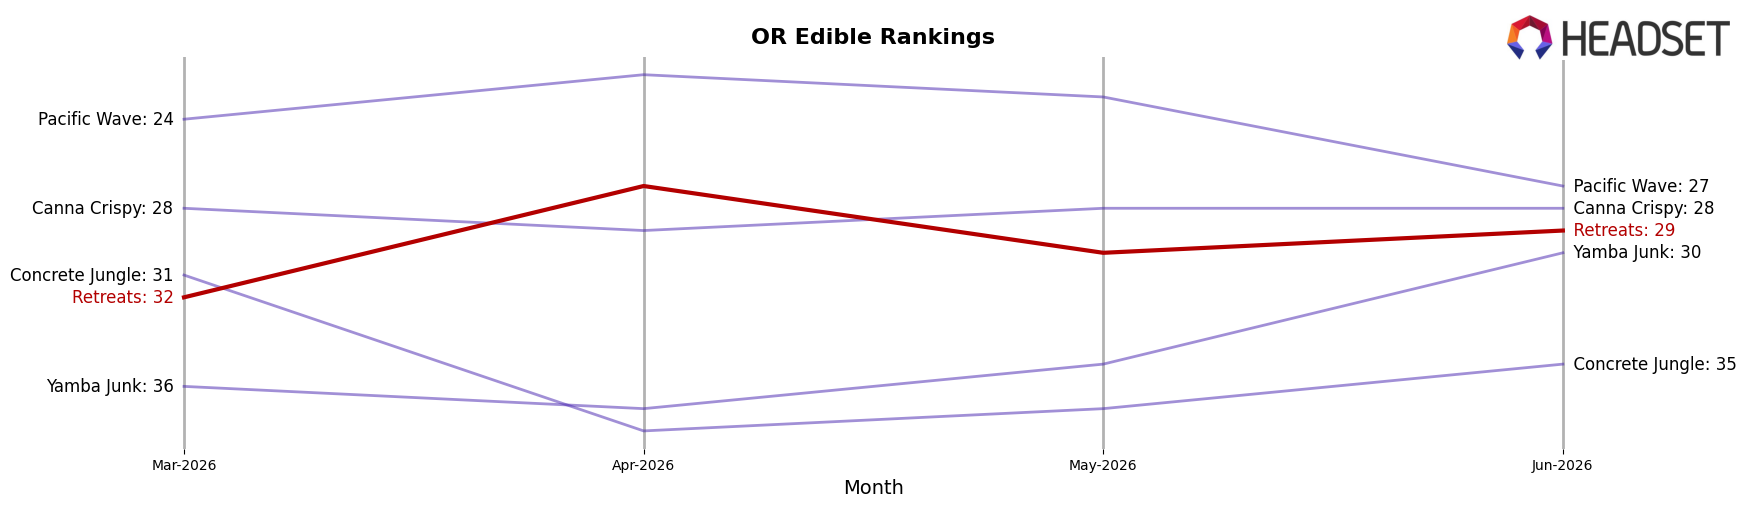
Retreats sits at rank #29 in Oregon Edible for June 2026, improving 3 positions year over year from #32 and 3 positions since March 2026 from #32, while its peak of #27 in April 2026 indicates a brief two-rank surge that did not persist. In contrast, Wyld held #1 both this June and a year ago with a 45.3% YoY sales increase, whereas Gron / Grön stayed at #2 year over year despite a -104.6% YoY sales change, underscoring that top-tier rank stability is not purely sales-growth dependent in the short term. The pattern implies Retreats’ modest rank lift is anchored in incremental share defense rather than breakout momentum, and the April 2026 peak followed by a retreat to #29 points to a ceiling near the high-20s unless distribution or mix shifts create a step-change.
Notable Products
Hybrid Peach Passion Gummies 10-Pack (100mg) posted the steepest contraction at -61.6% MoM while sliding to rank 9, whereas Sativa Gummies 10-Pack (100mg) also retreated -16.3% at rank 5; together with CBD/THC 1:1 Passion Orange Guava Gummies 10-Pack (100mg CBD, 100mg THC) down -27.4% at rank 7, the downside is concentrated in flavor extensions and 1:1 formats. Hybrid Gummies 10-Pack (100mg) rose +46.5% MoM to rank 1 and generated $4,128, while Indica Very Berry Retreats Gummies (10mg) jumped +63.8% into rank 8; with eight of the top ten being Edible gummies SKUs, the leadership is anchored in core gummy lines rather than niche ratios. Indica Wild Berry Gummies 10-Pack (100mg) was mostly flat at +1.8% in rank 2 as Sativa Strawberry Guava Gummies 10-Pack (100mg) advanced +11.7% in rank 3, indicating strength clustered in classic strain-positioned SKUs over CBD/THC blends. The pattern implies Retreats is consolidating around mainstream gummy formats and strain-led flavors while pruning or repricing underperforming variants.
Top Selling Cannabis Brands
Data for this report comes from real-time sales reporting by participating cannabis retailers via their point-of-sale systems, which are linked up with Headset’s business intelligence software. Headset’s data is very reliable, as it comes digitally direct from our partner retailers. However, the potential does exist for misreporting in the instance of duplicates, incorrectly classified products, inaccurate entry of products into point-of-sale systems, or even simple human error at the point of purchase. Thus, there is a slight margin of error to consider. Brands listed on this page are ranked in the top twenty within the market and product category by total retail sales volume.

