.svg)


Market Insights Snapshot
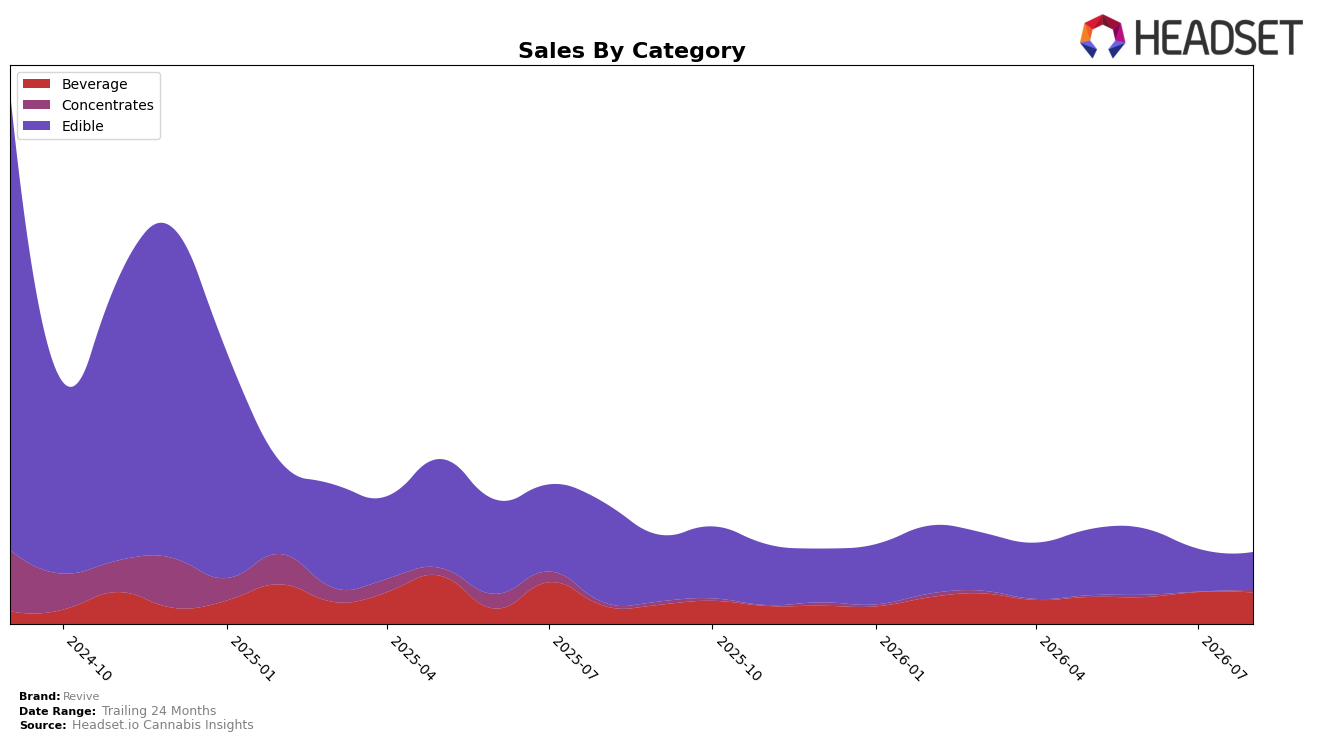
Revive’s mix in August 2026 tilted toward Edible at 53.18% share with year-over-year down 62.25% and month-over-month down 11.71%, while Beverage climbed to 43.76% share with year-over-year up 74.98% and month-over-month down 1.61%; Concentrates held 3.06% share with year-over-year down 27.21% and no month-over-month reading. Despite average price dropping 12.19% year-over-year to $13.63, brand sales fell 41.21% year-over-year and 82.14% over 24 months, indicating that the pivot toward Beverage growth is not yet offsetting the magnitude of Edible contraction.
The shift toward Beverage — rising 74.98% year-over-year yet still slipping 1.61% month-over-month — alongside Edible’s 11.71% month-over-month decline and 62.25% year-over-year drop implies Revive is migrating demand but not stabilizing its core; with Edible still 53.18% of mix versus Beverage at 43.76%, the category exposure leaves the brand vulnerable to further share erosion if Edible headwinds persist. In Ohio, where the brand’s concentration is highest, the absence of an Edible rank and the 27.21% year-over-year decline in Concentrates at a $29.75 average price suggest a need to re-anchor positioning around Beverage’s momentum while pruning low-velocity Edible SKUs to reduce drag.
Competitive Landscape
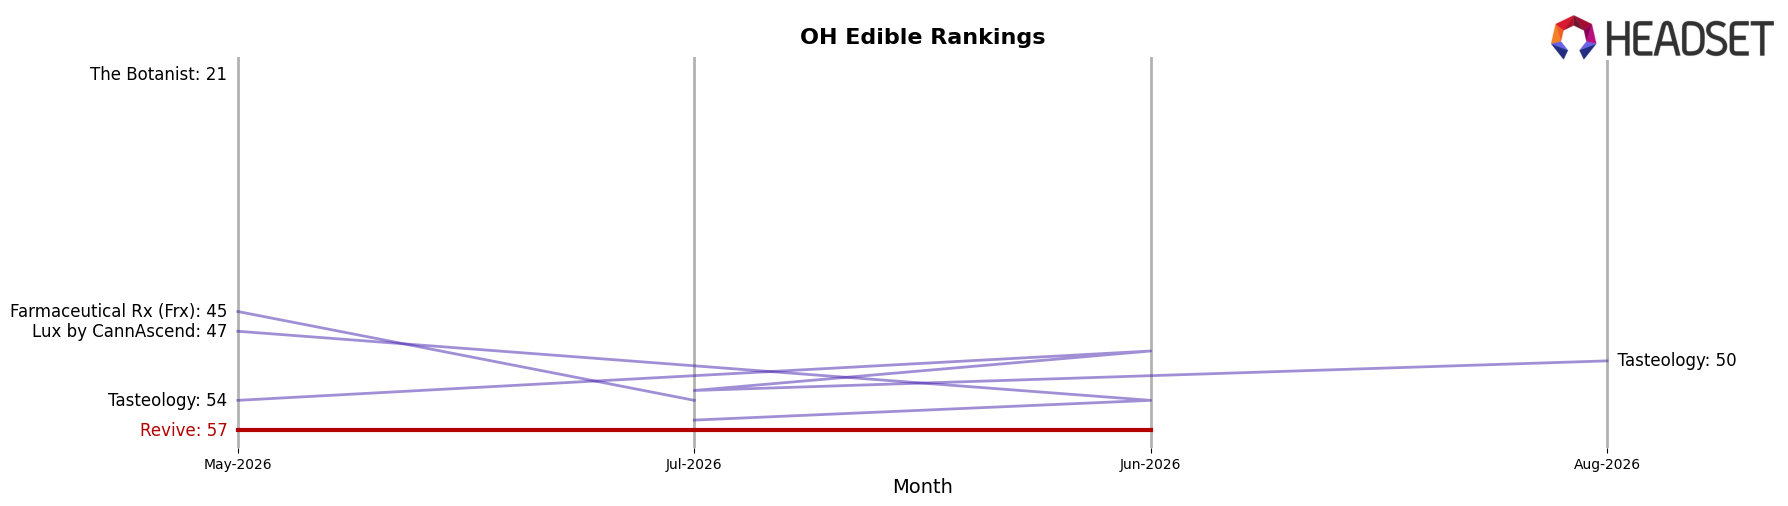
Revive ranks #55 in OH Edible in August 2026, slipping 5 positions year over year from #50 and drifting 2 spots from May 2026’s #57, while remaining far below its peak of #21 set in September 2024; by contrast, Gron / Grön climbed from #8 to #1 with a 91.3% YoY sales increase and Incredibles inched from #1 to #2 with 3.4% YoY growth, indicating that category leaders are consolidating share as Revive’s rank trajectory tilts downward.
Notable Products
Strawberry Syrup (100mg) posted the steepest movement in August 2026 with a -71.2% month-over-month drop and slid to rank 10, while Chocolate Syrup 10-Pack (100mg) fell -55.5% and held rank 8. In contrast, Cookies & Cream Chocolate 10-Pack (100mg) climbed +37.3% and reached rank 4, but five of the top ten are Edible SKUs, indicating the category is crowded even as some syrup formats retreat. This pattern implies Revive’s mix is tilting away from niche Beverage syrups toward scalable Edible propositions despite Blue Razzberry Fruit Drink (100mg THC, 6.7oz) maintaining rank 1 with +6.2% growth and $6,401 in sales.
Top Selling Cannabis Brands






Data for this report comes from real-time sales reporting by participating cannabis retailers via their point-of-sale systems, which are linked up with Headset’s business intelligence software. Headset’s data is very reliable, as it comes digitally direct from our partner retailers. However, the potential does exist for misreporting in the instance of duplicates, incorrectly classified products, inaccurate entry of products into point-of-sale systems, or even simple human error at the point of purchase. Thus, there is a slight margin of error to consider. Brands listed on this page are ranked in the top twenty within the market and product category by total retail sales volume.

