.svg)


Market Insights Snapshot
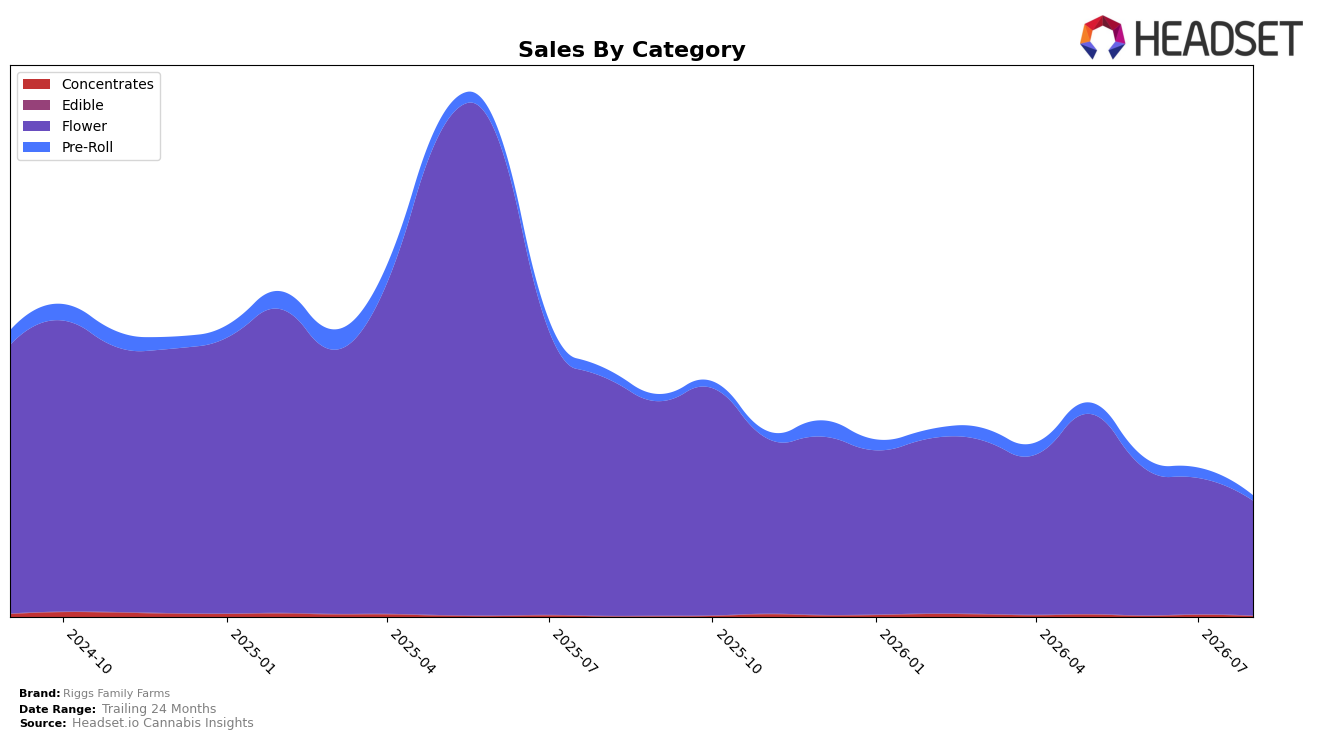
In August 2026, Riggs Family Farms concentrated 95.21% of sales in Flower, where year-over-year sales declined 51.93% and month-over-month fell 15.78%, while Pre-Roll held 4.17% share with a 44.42% YoY drop and a 49.76% MoM decline. Concentrates represented just 0.62% share but had a 43.89% YoY increase paired with a 63.24% MoM contraction, and average price across the brand rose 6.06% YoY to $26.26. This mix indicates over-reliance on Flower magnifies overall volatility as category headwinds compound monthly softness, and the divergent YoY/MoM directions in Concentrates suggest small-batch or episodic distribution that limits durable share gains.
With Flower ranking 21 in Arizona and accounting for 95.21% of the portfolio, the brand’s positioning remains tied to a single-category rank that can compress overall visibility when that category declines 51.93% YoY even if prices in that lane trend higher. The 4.17% Pre-Roll share and 0.62% Concentrates share are too small to offset a 15.78% MoM Flower slide, implying that near-term stabilization requires either expanding secondary categories that can grow above 10% share or moderating Flower exposure to reduce sensitivity to single-lane downturns.
Competitive Landscape
Riggs Family Farms ranks #21 in AZ Flower in August 2026, down 8 positions year over year from #13, and 3 positions lower than May 2026’s #18; against its historic peak of #4 in June 2025, the current placement marks a 17-rank slide while category leaders like Just Flower held #1 year over year and The Pharm jumped 16 spots from #21 to #5 alongside a 289.63% YoY sales surge. Compared with Find. climbing from #3 to #2 and Mohave Cannabis Co. slipping from #2 to #3, Riggs Family Farms’ 3-position decline since May and 8-position YoY drop indicate share is consolidating at the top while mid-pack churn intensifies; the trajectory implies Riggs Family Farms is losing relative velocity and will need mix or distribution changes to re-enter the top 15.

Notable Products
The steepest decline came from Cookies and Cream (3.5g), down 44.8% month over month to rank 3 while Double Scoop Pre-Roll (1g) slipped 11.4% to rank 4, signaling pressure on smaller pack sizes and single-count formats in August 2026. Mandarin Sunset Pre-Roll (1g) was the only mover up, rising 7.3% MoM to rank 2 while Cookies and Cream (14g) held rank 1 with $45,980, indicating velocity is consolidating at the top even as mid-pack churns. Four of the top ten are Flower SKUs and three of those are 7g or 14g formats, coupled with a top spot for a 14g pack and a decline in a 3.5g pack, implying demand is tilting toward larger Flower sizes and away from smaller units. The mix suggests Riggs Family Farms is concentrating around larger Flower packs with selective Pre-Roll traction, pointing to a pricing and assortment strategy favoring value-weight formats over breadth in smaller SKUs.
Top Selling Cannabis Brands






Data for this report comes from real-time sales reporting by participating cannabis retailers via their point-of-sale systems, which are linked up with Headset’s business intelligence software. Headset’s data is very reliable, as it comes digitally direct from our partner retailers. However, the potential does exist for misreporting in the instance of duplicates, incorrectly classified products, inaccurate entry of products into point-of-sale systems, or even simple human error at the point of purchase. Thus, there is a slight margin of error to consider. Brands listed on this page are ranked in the top twenty within the market and product category by total retail sales volume.

