.svg)

Sep-2026
Sales
Trend
6-Month
Product Count
SKUs
Avg Price
YoY Sales Change
YoY Price Change




Where to Buy
Grassroots is stocked at 906 licensed dispensaries across New York, Illinois, and 15 other states, 223 of them in New York, with the deepest coverage in New York, Brooklyn, Queens, Staten Island, and The Bronx. Search by ZIP code or city below to find the closest one, or filter by product type if you are after a specific format.
Market Insights Snapshot
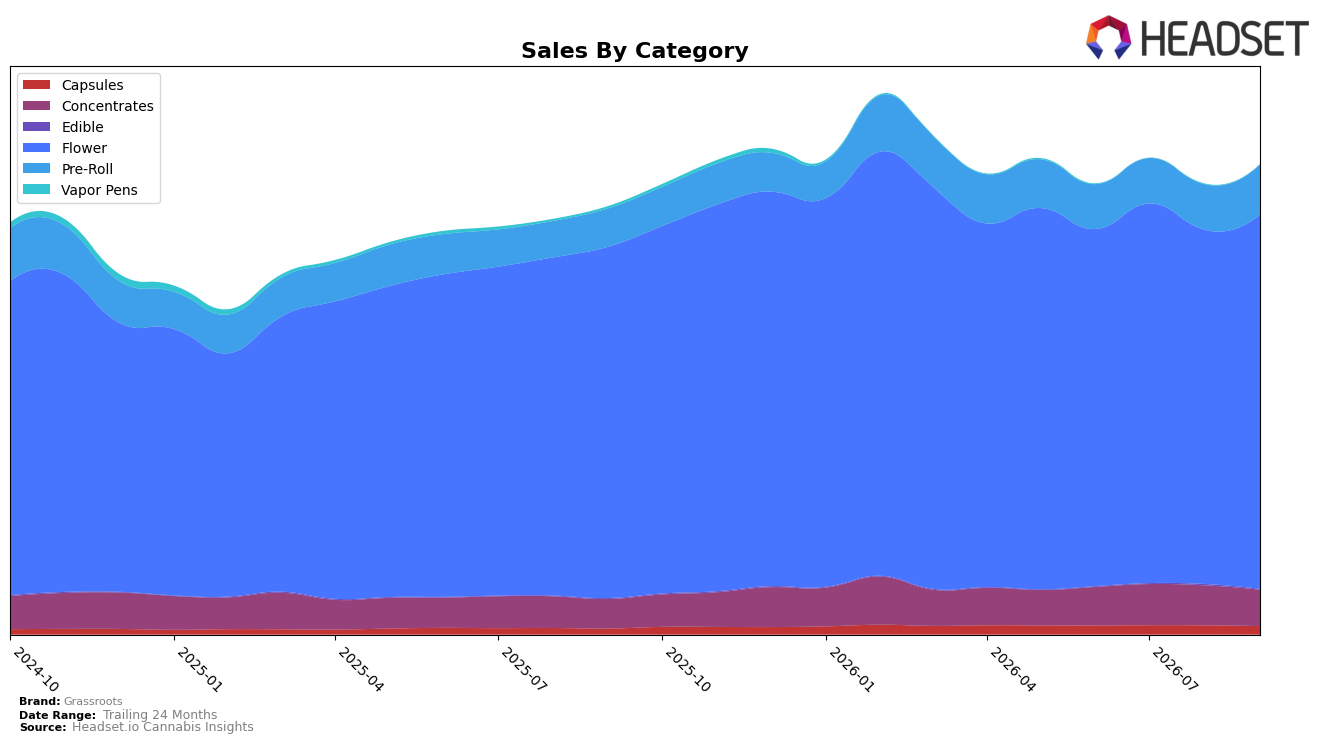
In September 2026, Grassroots concentrated 79.84% of sales in Flower, rising 6.54% year over year and 5.64% month over month, while Pre-Roll expanded to 10.61% share with 30.82% YoY and 10.15% MoM growth. Concentrates held 7.67% share with 23.11% YoY growth but declined 9.27% MoM, and Capsules at 1.74% grew 43.11% YoY despite an 8.96% MoM dip. Edible remained marginal at 0.12% share with 11.04% YoY growth but a 37.65% MoM slide, and Vapor Pens contracted to 0.02% share with a 96.40% YoY and 73.99% MoM drop. The pattern implies a deliberate tilt toward combustion formats, with Flower and Pre-Roll absorbing demand as Vapor Pens retreat and smaller formats contribute opportunistically.
With Flower ranked 2 in New York and brand-wide average prices down 5.07% YoY to $33.15, the mix suggests price-enabled trade-up within Flower alongside value-entry Pre-Rolls expanding basket incidence. Double-digit MoM gains in Flower (+5.64%) and Pre-Roll (+10.15%) against concurrent MoM pullbacks in Concentrates (-9.27%) and Capsules (-8.96%) point to a positioning anchored in high-frequency inhalable use rather than niche potency or wellness segments. This split, coupled with 9.86% brand sales YoY growth and 42.64% growth over 24 months, implies Grassroots is consolidating share through depth in mainstream inhalables while de-prioritizing Vapor Pens, using price to defend rank in Flower and to widen the entry ramp via Pre-Roll.
Competitive Landscape
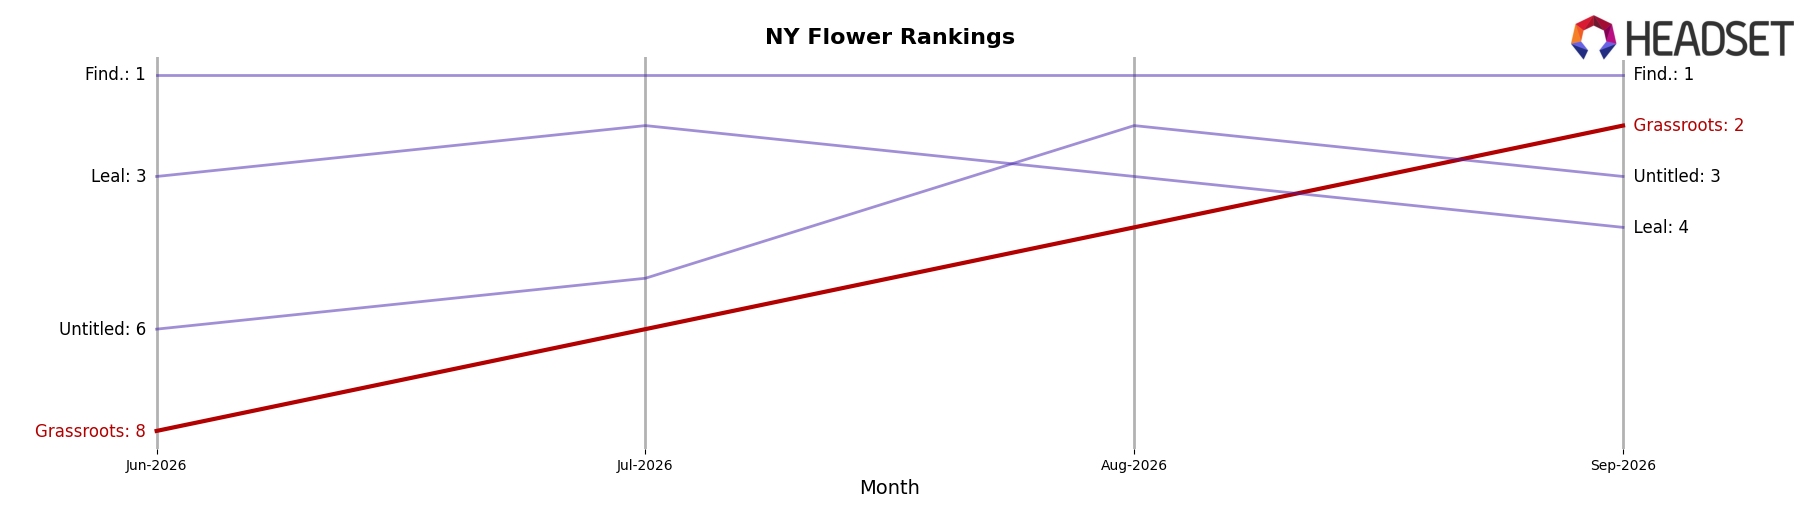
Grassroots is ranked #2 in NY Flower in September 2026, up 13 positions year over year from #15, and up 6 positions versus June 2026 when it sat at #8, indicating a rapid late-cycle surge; meanwhile, Find. holds #1 after rising from #5 year over year with a 16.2% sales increase, and Untitled sits at #3 after moving from #9 alongside a 44.9% sales lift, placing Grassroots in a narrow gap where holding #2 requires outpacing a top competitor’s double-digit growth while preventing share leakage to a fast-rising #3—this rank trajectory implies Grassroots has transitioned from mid-pack to category contender, but sustaining #2 or challenging for #1 will hinge on converting recent momentum into share defense against accelerating rivals.
Notable Products
Triple Mints (3.5g) is the pivot in September 2026, dropping 26.3% month over month to rank 5 while GMO (3.5g) fell 20.6% at rank 6, and Blue Lobster (3.5g) in the top position slipped 1.9%, signaling pressure within established Flower SKUs. Floral Frost (3.5g) moved counter to that pattern with a 1.7% month-over-month gain at rank 4, while Flower products occupy 8 of the top 10, indicating portfolio concentration that magnifies volatility when multiple mid-tier Flower SKUs contract simultaneously. With Pre-Roll entries limited to ranks 3 and 9 and Flower carrying the revenue load near $218,212 for the leader, the mix points to a brand leaning into flagship Flower while needing diversified growth levers beyond a narrow set of strains.
Top Selling Cannabis Brands






Data for this report comes from real-time sales reporting by participating cannabis retailers via their point-of-sale systems, which are linked up with Headset’s business intelligence software. Headset’s data is very reliable, as it comes digitally direct from our partner retailers. However, the potential does exist for misreporting in the instance of duplicates, incorrectly classified products, inaccurate entry of products into point-of-sale systems, or even simple human error at the point of purchase. Thus, there is a slight margin of error to consider. Brands listed on this page are ranked in the top twenty within the market and product category by total retail sales volume.

