Jun-2026
Sales
Trend
6-Month
Product Count
SKUs
Avg Price
YoY Sales Change
YoY Price Change
Market Insights Snapshot
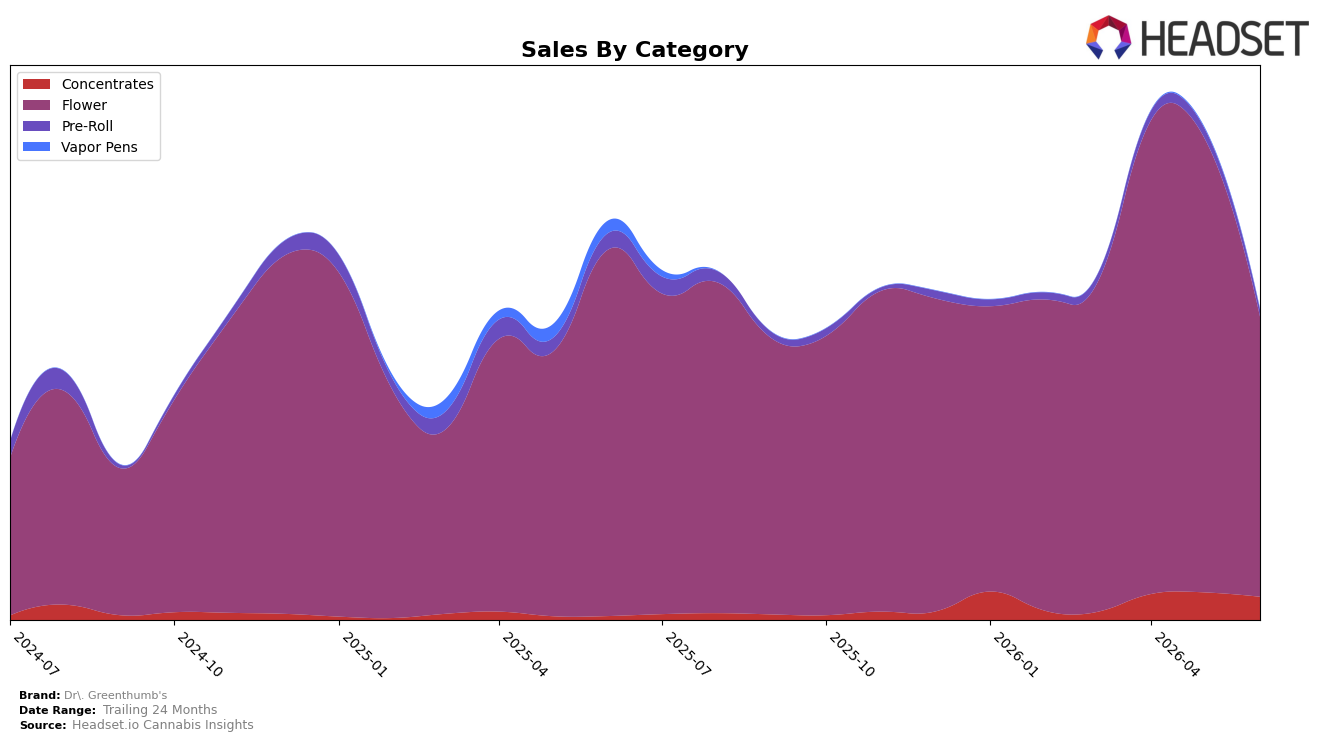
In June 2026, Dr. Greenthumb's concentrated even further into Flower at 90.09% share while the category contracted by 23.60% year over year and 38.31% month over month; in contrast, Concentrates expanded to 7.47% share with a 494.24% year-over-year surge but still fell 15.94% month over month. Pre-Roll slipped to 2.18% share with a 58.06% year-over-year decline and a 29.39% month-over-month drop, and Vapor Pens compressed to 0.26% share with a 93.40% year-over-year fall and a 17.39% month-over-month decrease. With overall brand sales down 22.04% year over year and average price up 5.06%, the mix implies overexposure to a retreating Flower base while the fast-growing but small Concentrates line has not yet offset repeated month-over-month declines, pointing to near-term volume risk if the current share weights persist.
Positioning-wise, holding the number 12 rank in Flower in Arizona while Flower posts a 38.31% month-over-month decline and a 23.60% year-over-year drop suggests mid-tier visibility without insulation from category cyclicality; the 90.09% mix weight amplifies that exposure. The 494.24% year-over-year gain in Concentrates from a 7.47% share base and a 15.94% month-over-month dip indicates elasticity and trial but limited repeat, while the 58.06% year-over-year and 29.39% month-over-month contractions in Pre-Roll, alongside a 93.40% year-over-year decline in Vapor Pens at 0.26% share, signal weak adjacency traction. The pattern implies Dr. Greenthumb's is positioned as a Flower-led brand with price-led value capture (average price +5.06%) that trades off volume (-22.04% YoY), and future resilience hinges on rebalancing toward Concentrates without eroding the Arizona Flower ranking.
Competitive Landscape
Dr. Greenthumb's sits at rank #12 in June 2026, down 6 places year over year and 3 places since March 2026, after peaking at #5 in April 2026. Meanwhile, Just Flower held #1 with a 13.0% YoY sales increase while Dr. Greenthumb's slipped from #9 to #12 quarter-over-quarter, and Brown Bag advanced to #5 from #7 YoY alongside a 72.8% sales lift, creating upward pressure that coincides with Dr. Greenthumb's rank erosion. With The Pharm moving from #5 to #4 on 44.1% YoY growth and Mohave Cannabis Co. holding #3 despite a -13.9% YoY sales decline, the pattern implies Dr. Greenthumb's mid-pack share is being compressed by faster risers above and resilient incumbents, signaling a trajectory toward the lower teens unless momentum from April 2026 is reactivated.

Notable Products
Donny Burger (14g) posted the steepest decline in June 2026, down 64.5% month over month while slipping to rank 5, which contrasts with Kush Mints (3.5g) rising 33.2% MoM to rank 1. Lemon Royale (3.5g) fell 20.8% to rank 3 as Kronologik (3.5g) dropped 21.7% to rank 4, indicating share is shifting toward a single winning eighth rather than multiple mids. With eight of the top ten SKUs concentrated in Flower 14g packs, the divergence between a growing 3.5g leader and declining large formats suggests basket-size optimization may be giving way to trial-sized velocity. The pattern implies Dr. Greenthumb's is pivoting toward higher-rotation 3.5g hero SKUs while de-emphasizing bulk Flower, a mix that prioritizes rank stability over volume swings.
Top Selling Cannabis Brands
Data for this report comes from real-time sales reporting by participating cannabis retailers via their point-of-sale systems, which are linked up with Headset’s business intelligence software. Headset’s data is very reliable, as it comes digitally direct from our partner retailers. However, the potential does exist for misreporting in the instance of duplicates, incorrectly classified products, inaccurate entry of products into point-of-sale systems, or even simple human error at the point of purchase. Thus, there is a slight margin of error to consider. Brands listed on this page are ranked in the top twenty within the market and product category by total retail sales volume.

