Jun-2026
Sales
Trend
6-Month
Product Count
SKUs
Avg Price
YoY Sales Change
YoY Price Change
Market Insights Snapshot
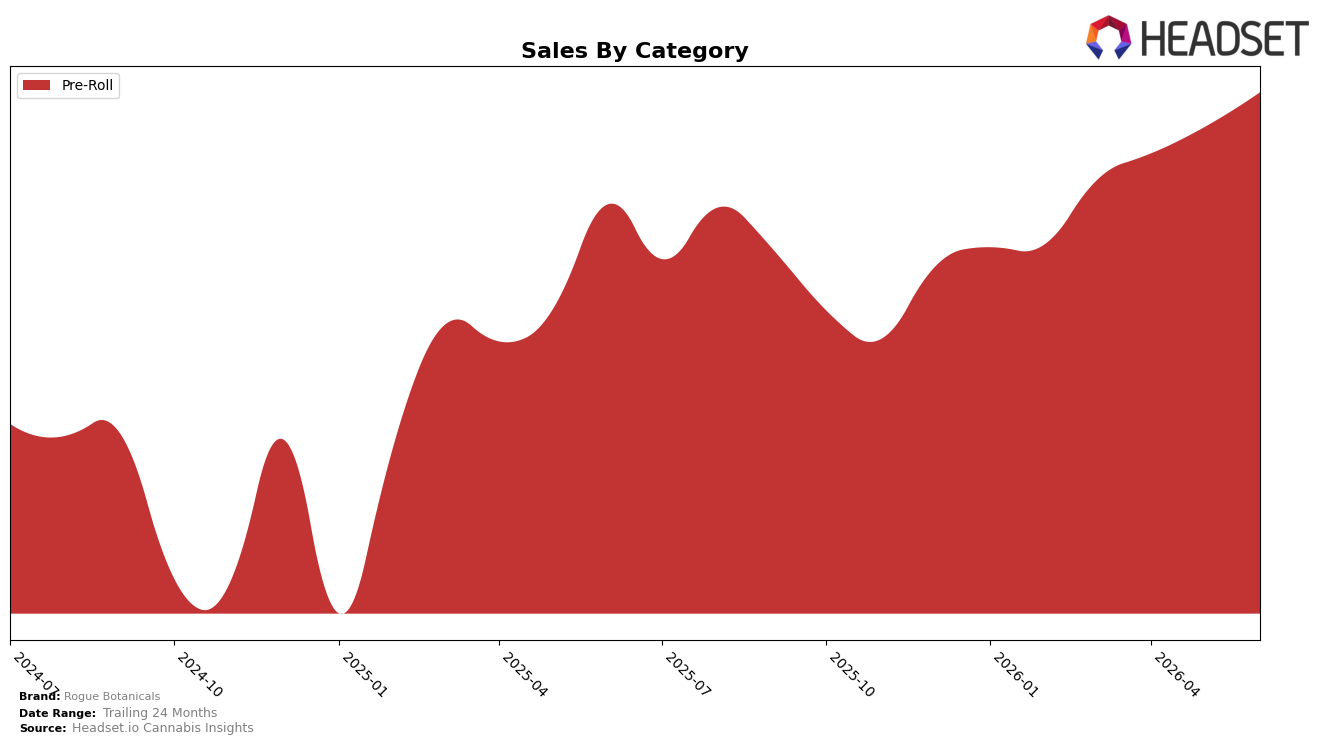
Rogue Botanicals concentrated entirely in Pre-Roll during June 2026, with Pre-Roll holding 100.0% of category mix and ranking 9 within Saskatchewan Pre-Roll, while average price declined 2.61% year over year alongside a 6.19% month-over-month sales lift. Year-over-year sales grew 23.17% in June 2026 within Pre-Roll while the 24-month sales change was 321.31%, indicating scale built over two years even as June’s rank position at 9 suggests mid-pack placement; the pattern implies momentum is tied to price-accessible Pre-Rolls rather than breadth across categories.
The combination of a 23.17% year-over-year sales increase and a 2.61% price decrease points to elasticity-driven volume gains, while a 6.19% month-over-month uptick alongside rank 9 implies incremental share capture without breaking into top-tier ranks. With 100.0% of sales in a single category, the brand’s positioning leans into value within Pre-Roll rather than portfolio diversification, implying that sustaining growth likely depends on defending price while improving unit velocity to climb from rank 9.
Competitive Landscape
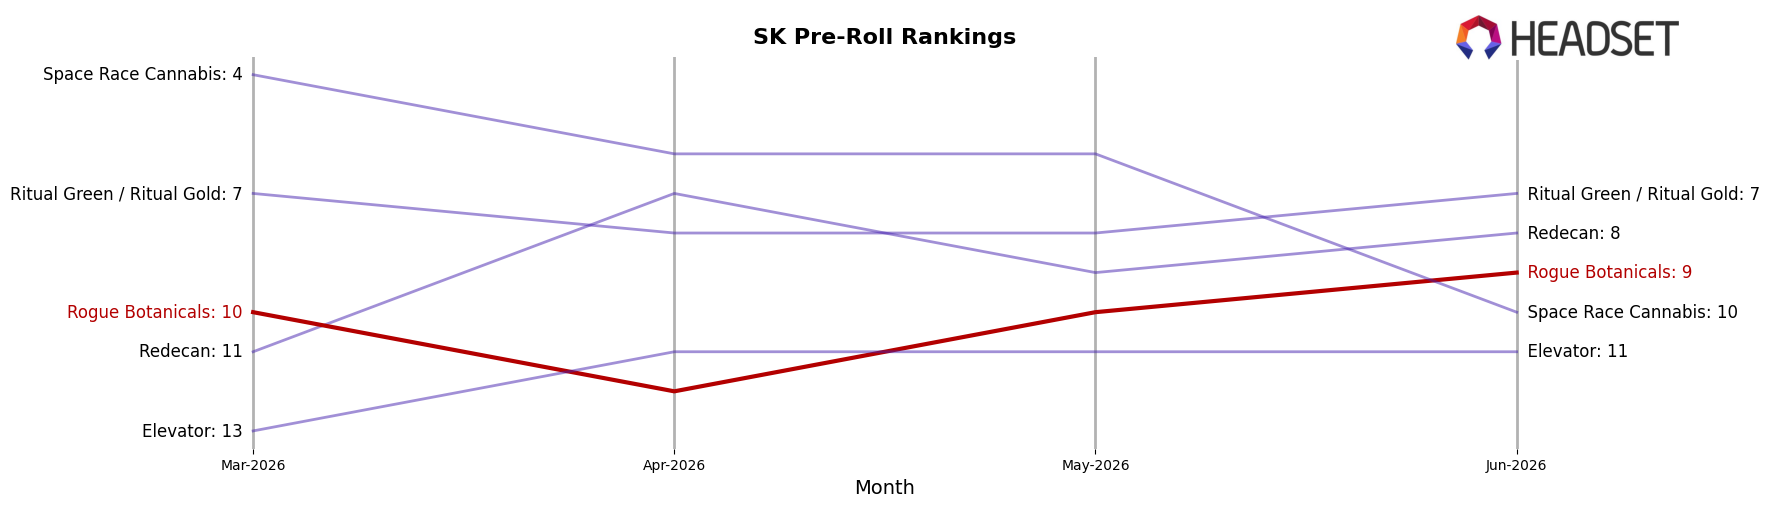
Rogue Botanicals is currently ranked #9 in SK Pre-Roll, improving 1 position from #10 year over year and edging up 1 spot from #10 in March 2026 to reach a peak of #9 in June 2026, while Back Forty / Back 40 Cannabis held #1 with 134.25% YoY sales growth and Doobie Snacks climbed from #9 to #3 with 282.03% YoY growth; in contrast, Spinach slipped from #3 to #4 despite 39.68% YoY growth and General Admission moved from #4 to #5 with 35.82% YoY growth, indicating that Rogue Botanicals’ modest rank lift amid competitors’ triple-digit gains places it in a stabilization phase where share protection, not price-led expansion, is the near-term implication.
Notable Products
Cambodian Pre-Roll 4-Pack (2g) posted a +6.2% month-over-month lift in June 2026 and held rank 1, with approximately $164,225 in sales, indicating stability at the top rather than a breakout move. With only one top-10 SKU recorded and it sitting in Pre-Roll, the assortment skews toward a single-format concentration rather than a diversified range across categories. The pattern implies Rogue Botanicals is consolidating around a flagship Pre-Roll offering, prioritizing depth in one hero SKU over breadth across multiple product families.
Top Selling Cannabis Brands
Data for this report comes from real-time sales reporting by participating cannabis retailers via their point-of-sale systems, which are linked up with Headset’s business intelligence software. Headset’s data is very reliable, as it comes digitally direct from our partner retailers. However, the potential does exist for misreporting in the instance of duplicates, incorrectly classified products, inaccurate entry of products into point-of-sale systems, or even simple human error at the point of purchase. Thus, there is a slight margin of error to consider. Brands listed on this page are ranked in the top twenty within the market and product category by total retail sales volume.

