Jun-2026
Sales
Trend
6-Month
Product Count
SKUs
Avg Price
YoY Sales Change
YoY Price Change
Market Insights Snapshot
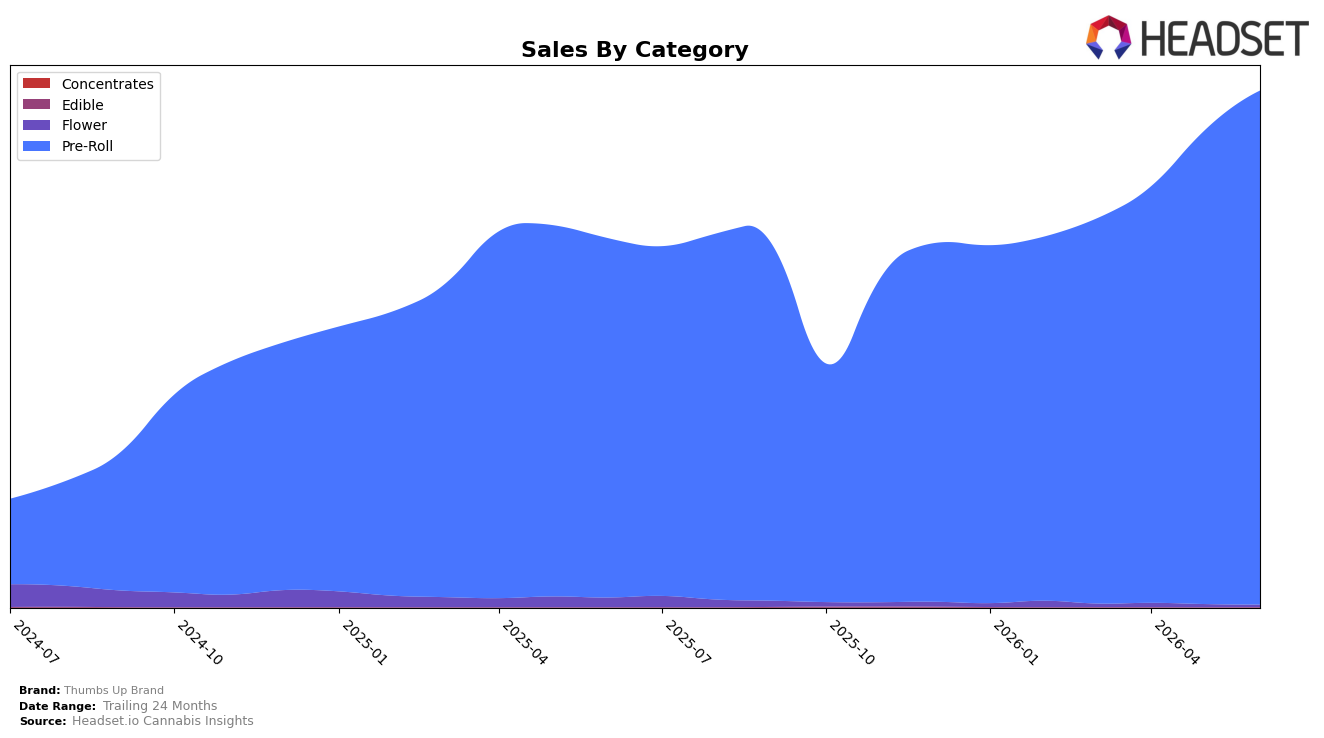
In June 2026, Thumbs Up Brand concentrated 99.57% of sales in Pre-Roll, where category sales grew 43.12% year over year and 8.52% month over month, while average price across the brand fell 7.91% YoY, indicating volume-led expansion. Flower contracted to 0.40% share with a 77.64% YoY decline and a 23.41% MoM drop, as average price in that category sat at one of the brand’s highest ticket points. Micro-categories on the fringe moved unevenly: Concentrates held just 0.01% share but jumped 198.91% MoM off a small base, whereas Edible reached 0.01% share with a 502.03% YoY increase and no MoM reading, suggesting a recent launch or intermittent distribution. With Pre-Roll anchoring the mix and rank at position 3 in Ontario Pre-Roll, the pattern implies Thumbs Up Brand is reinforcing a single-category scale position while deprioritizing Flower and testing low-share extensions.
The combination of a 40.11% YoY brand sales lift alongside a 7.91% YoY price decline implies the June 2026 trajectory is driven by unit growth in Pre-Roll rather than pricing, consistent with maintaining rank 3 in Ontario Pre-Roll and gaining from mix concentration. The outsized MoM gain in Concentrates at 198.91% and the 502.03% YoY surge in Edible, each at approximately 0.01% share, point to exploratory bets that currently lack scale versus the 99.57% Pre-Roll share; if sustained, these could hedge against Pre-Roll volatility without diluting the current price-volume strategy. Net effect: the brand’s positioning is that of a Pre-Roll specialist competing on volume and accessibility, using selective, very small-share category trials to probe margin and future shelf leverage.
Competitive Landscape
Thumbs Up Brand sits at rank #3 in ON Pre-Roll in June 2026, up 5 positions from #8 year over year, and up 2 positions from #5 in March 2026; this rise coincides with reaching a new peak rank of #3 in June 2026 while closing the gap on Back Forty / Back 40 Cannabis, which climbed from #3 to #1, and widening distance from Jeeter, which fell from #2 to #4 with a 48.5% YoY sales decline. Relative positioning also shifted against General Admission, which slipped from #1 to #2 alongside a 17.9% YoY sales contraction, contrasting with Thumbs Up Brand’s upward rank change of +5 and a nearer-term +2 lift since March 2026; the pattern implies Thumbs Up Brand is transitioning from a challenger to a consistent top-three incumbent with line-of-sight to #2 if current share dynamics persist.

Notable Products
Hybrid Pre-Roll 2-Pack (2g) posted the standout move in June 2026 with a 120.8% month-over-month jump and a top-3 rank at #3, while Indica x Sativa Pre-Roll 2-Pack (2g) slid 11.2% MoM and sits at #4. The top two spots remain anchored by Indica Pre-Roll 2-Pack (2g) at #1 with +5.4% MoM and Sativa Pre-Roll 2-Pack (2g) at #2 with +14.8% MoM, concentrating momentum in small 2-pack formats. Four of the top five are 2-pack Pre-Rolls and six of the top ten are 2-packs overall, indicating a tilt toward trial- or price-point entry sizes despite one mixed-hybrid variant declining, which implies Thumbs Up Brand is consolidating share in compact, repeatable pre-roll formats rather than pushing larger multi-pack volume.
Top Selling Cannabis Brands
Data for this report comes from real-time sales reporting by participating cannabis retailers via their point-of-sale systems, which are linked up with Headset’s business intelligence software. Headset’s data is very reliable, as it comes digitally direct from our partner retailers. However, the potential does exist for misreporting in the instance of duplicates, incorrectly classified products, inaccurate entry of products into point-of-sale systems, or even simple human error at the point of purchase. Thus, there is a slight margin of error to consider. Brands listed on this page are ranked in the top twenty within the market and product category by total retail sales volume.

