.svg)


Where to Buy
Root and Sol is stocked at 15 licensed dispensaries across Michigan, with the deepest coverage in Detroit, Inkster, New Buffalo, Ann Arbor, and Hazel Park. Search by ZIP code or city below to find the closest one, or filter by product type if you are after a specific format.
Market Insights Snapshot
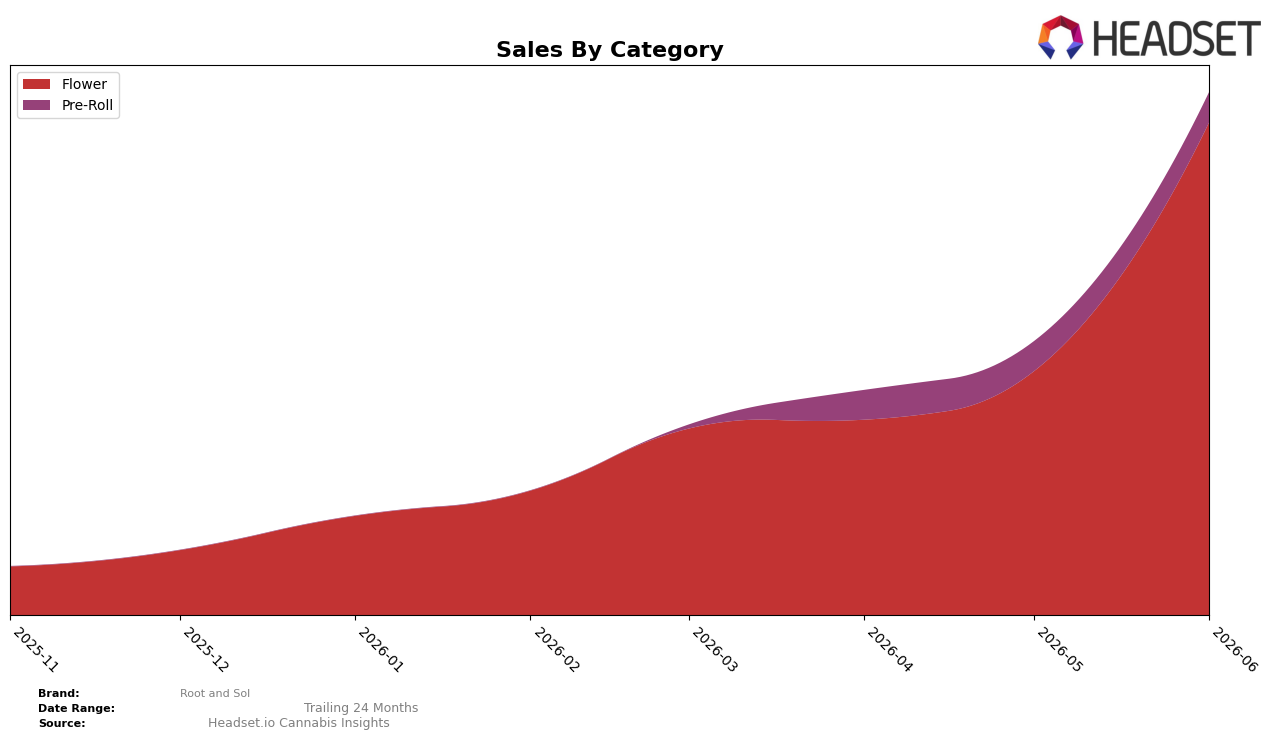
Root and Sol concentrated 94.26% of June 2026 sales in Flower, while Pre-Roll accounted for 5.74%, with Flower up 102.45% month over month versus Pre-Roll up 1.09% month over month. Average ticket divergence widened, with Flower at $25.69 against Pre-Roll at $4.56, reinforcing a skew toward higher-priced units as the category mix tilts further to Flower. The state-category position landed at rank 24 in Flower within Michigan, indicating that the surge in Flower share and the 102.45% month-over-month climb coexisted with a middling rank, implying momentum without a corresponding jump in market standing.
The 94.26% Flower reliance combined with a 102.45% month-over-month gain positions Root and Sol as a single-category specialist rather than a balanced portfolio, while the 5.74% Pre-Roll share and 1.09% month-over-month pace limit cross-category insulation. Given rank 24 in Flower in Michigan and the wide unit price gap ($25.69 vs. $4.56), the brand is competing on premium-leaning Flower rather than basket-building via lower-priced Pre-Rolls. The pattern implies that sustained growth will hinge on defending Flower velocity at rank 24 while either nudging Pre-Roll above 6% share or extracting trade-up within Flower, because a 100%+ month-over-month spike concentrated in one category elevates exposure to category-specific volatility.
Competitive Landscape
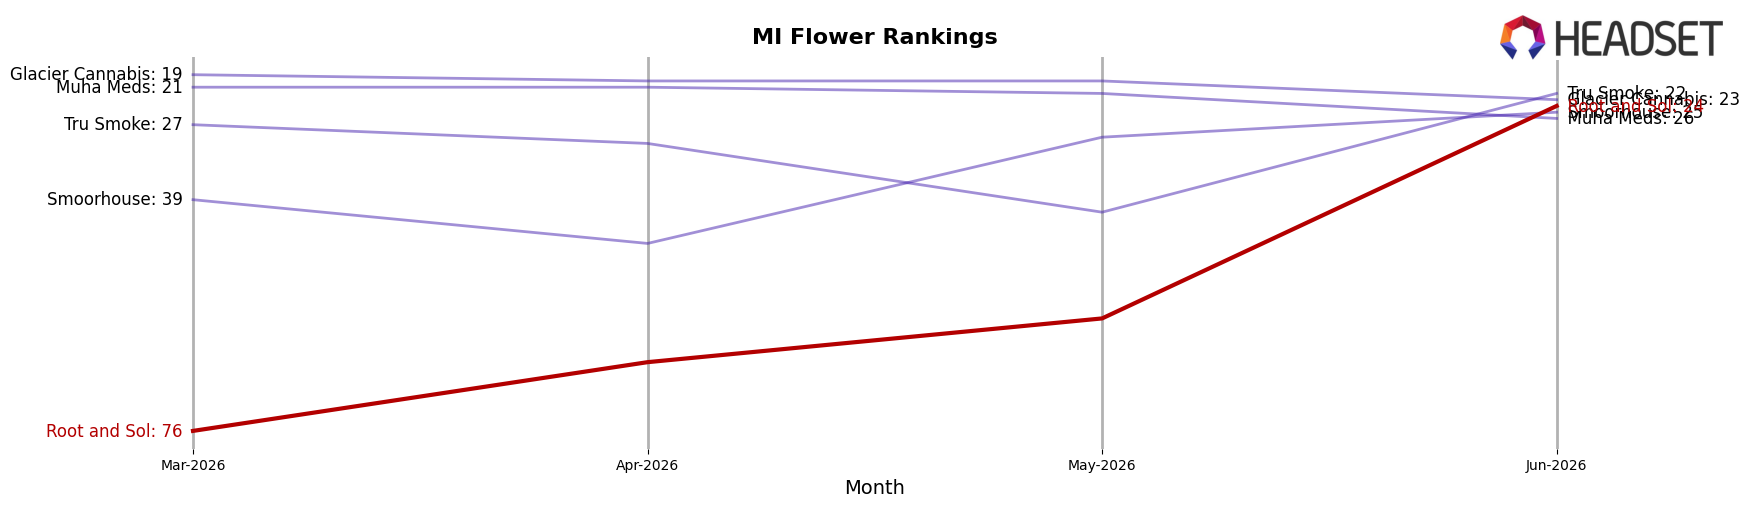
Root and Sol sits at rank #24 in MI Flower in June 2026, improving 52 positions from #76 in March 2026, while the year-over-year rank figure is unavailable and therefore neutral to trend inference. Against the competitive set, High Minded holds #1 despite a -13.7% sales change year over year, and Goodlyfe Farms advanced from #5 to #2 with a 44.1% YoY sales increase; in contrast, Root and Sol’s jump to a peak rank of #24 in June 2026 from #76 three months prior indicates recent velocity outpacing the ladder movement of top incumbents even as absolute sales leadership remains concentrated at the top. The pattern implies Root and Sol’s trajectory is momentum-driven and timing-sensitive: rapid quarter-over-quarter rank gains can convert into sustained share only if the brand continues closing the distance to the top 20 while competitors either contract or grow at sub-Root-and-Sol rates.
Notable Products
Blue Dream (Bulk) delivered the sharpest move in June 2026 with a +41.6% month-over-month rise into rank 5, while Pineapple Pop Infused Pre-Roll (2g) slipped 8.0% at rank 9. The top four ranks are Flower SKUs, with Blue Dream (28g) at rank 1 and Banana Banshee (28g) at rank 2, concentrating category weight at the top while Pre-Rolls cluster at ranks 6–10 with MoM swings ranging from +8.4% to -8.0%. This mix implies Root and Sol is anchored by large-format Flower leadership while testing incremental velocity in infused Pre-Rolls, steering commercial focus toward defending premium Flower ranks and selectively optimizing a Pre-Roll portfolio with volatile but modest-scale gains.
Top Selling Cannabis Brands






Data for this report comes from real-time sales reporting by participating cannabis retailers via their point-of-sale systems, which are linked up with Headset’s business intelligence software. Headset’s data is very reliable, as it comes digitally direct from our partner retailers. However, the potential does exist for misreporting in the instance of duplicates, incorrectly classified products, inaccurate entry of products into point-of-sale systems, or even simple human error at the point of purchase. Thus, there is a slight margin of error to consider. Brands listed on this page are ranked in the top twenty within the market and product category by total retail sales volume.

