.svg)

Sep-2026
Sales
Trend
6-Month
Product Count
SKUs
Avg Price
YoY Sales Change
YoY Price Change


Where to Buy
Ruby Farms is stocked at 257 licensed dispensaries across New York and Oklahoma, 256 of them in New York, with the deepest coverage in New York, Brooklyn, Queens, Staten Island, and Buffalo. Search by ZIP code or city below to find the closest one, or filter by product type if you are after a specific format.
Market Insights Snapshot
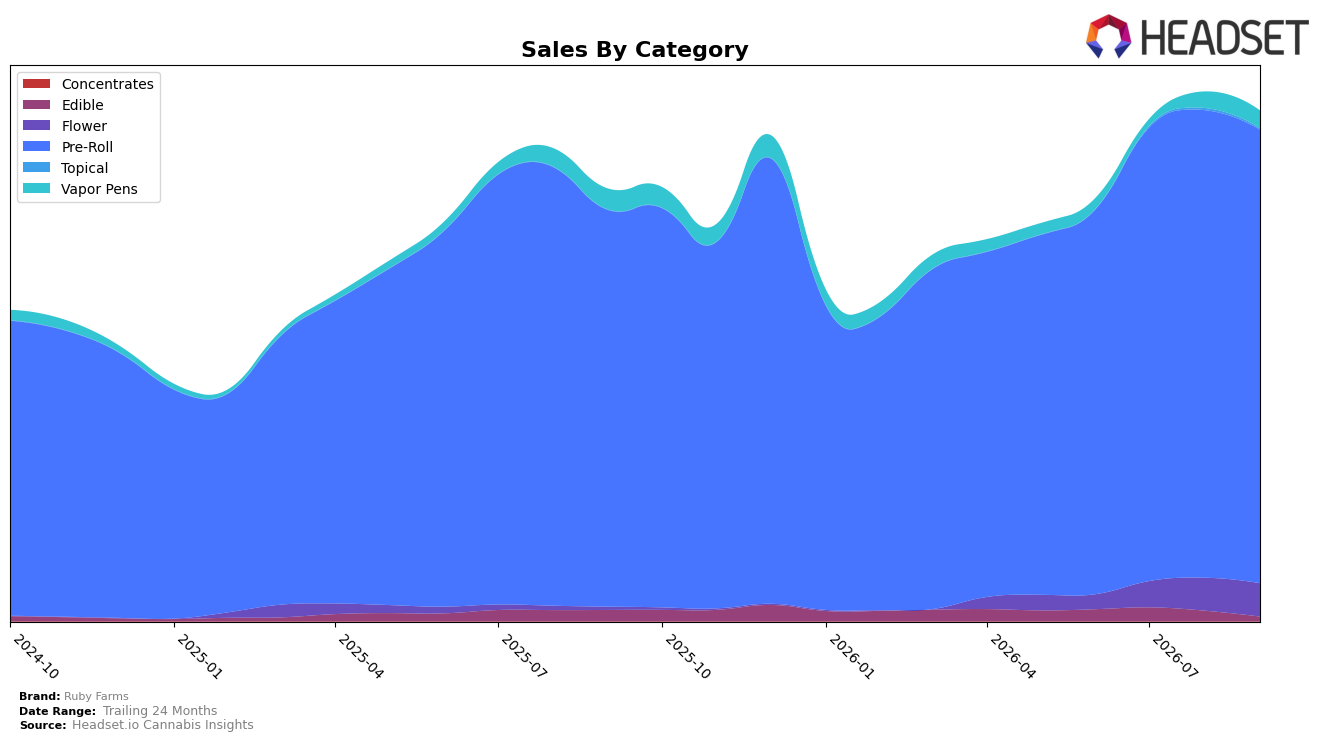
Ruby Farms concentrated 89.05% of September 2026 sales in Pre-Roll, where year-over-year sales grew 14.36% but month-over-month dipped 3.00%, while Flower expanded to a 6.47% share on a 1,057.33% year-over-year surge and a 1.14% month-over-month rise. Vapor Pens held 3.39% share with a 16.17% year-over-year decline yet a 7.04% month-over-month uptick, and Edible contracted to 0.86% share with a 59.99% year-over-year and 57.23% month-over-month drop; Topical slid 32.25% month-over-month with a 0.23% share and no prior-year comp. Average price slipped 0.23% year-over-year to $38.58, and Ruby Farms held rank 1 in Pre-Roll in New York; the pattern implies a deliberate tilt toward value within a Pre-Roll-led portfolio while selectively reigniting Flower to diversify volume without materially eroding the price umbrella.
The shift pairs Pre-Roll dominance (rank 1 in New York and an 89.05% mix) with a targeted Flower relaunch that lifted category breadth by 1,057.33% year-over-year as Vapor Pens and Edible ceded mix by 16.17% and 59.99% year-over-year, respectively. With Pre-Roll softening 3.00% month-over-month while Vapor Pens and Flower rose 7.04% and 1.14% month-over-month, the mix implies Ruby Farms is cushioning single-category volatility by adding inhalable adjacency rather than leaning into low-mix, declining Edible and Topical, signaling positioning as a Pre-Roll-first inhalables brand using Flower as the secondary growth engine and Vapor Pens as a tactical stabilizer.
Competitive Landscape
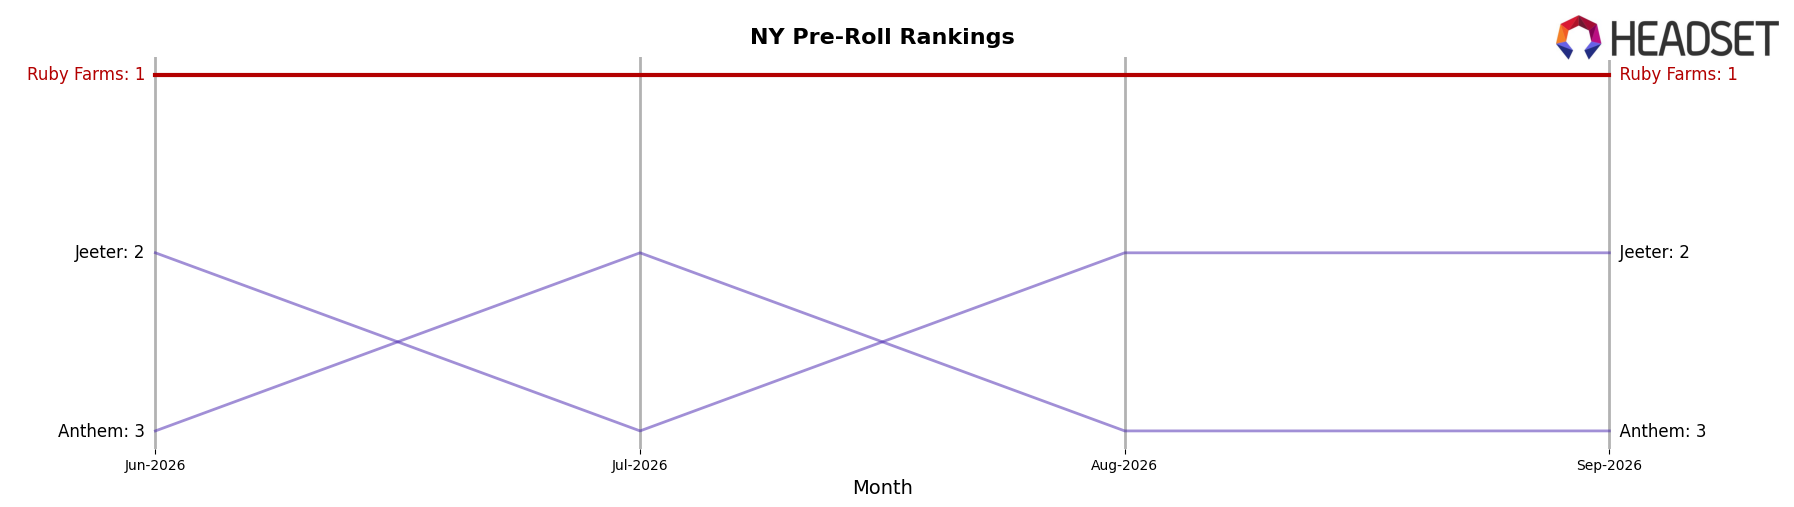
Ruby Farms holds rank #1 in NY Pre-Roll in September 2026, unchanged from #1 a year earlier, while Jeeter sits at #2 after improving from #6 year over year with 122.5% sales growth, and Anthem advanced to #3 from #22 alongside 381.5% growth; meanwhile, PICC Platform surged to #5 from #54 with 919.6% growth, outpacing Florist Farms which moved to #4 from #8 on 31.2% growth—this widening upward pressure from fast-climbing challengers implies Ruby Farms’ flat #1-to-#1 trajectory requires active defense to prevent share erosion as the rank gap compresses.
Notable Products
Classics - Sour Diesel Pre-Roll 7-Pack (3.5g) posted the standout move in September 2026 with +131.6% MoM to rank 1, while Classics - White Widow Pre-Roll 7-Pack (5g) slid -11.4% to rank 5, marking the steepest decline among the top ten. Doobies - Blue Dream Pre-Roll 7-Pack (3.5g) climbed +887.4% MoM into rank 2, contrasting with Doobies - White Widow Pre-Roll 7-Pack (3.5g) at -8.1% and rank 3, and nine of the top ten are Pre-Roll SKUs, concentrating mix risk in a single format. The top three SKUs collectively capture share through large-pack 7-Packs, with Blue Dream and Sour Diesel together adding over $569,000, implying Ruby Farms is consolidating demand around value-pack pre-rolls and classic strains to drive velocity over breadth.
Top Selling Cannabis Brands






Data for this report comes from real-time sales reporting by participating cannabis retailers via their point-of-sale systems, which are linked up with Headset’s business intelligence software. Headset’s data is very reliable, as it comes digitally direct from our partner retailers. However, the potential does exist for misreporting in the instance of duplicates, incorrectly classified products, inaccurate entry of products into point-of-sale systems, or even simple human error at the point of purchase. Thus, there is a slight margin of error to consider. Brands listed on this page are ranked in the top twenty within the market and product category by total retail sales volume.

