.svg)

Sep-2026
Sales
Trend
6-Month
Product Count
SKUs
Avg Price
YoY Sales Change
YoY Price Change


Where to Buy
Florist Farms is stocked at 307 licensed dispensaries across New York and Montana, 306 of them in New York, with the deepest coverage in New York, Brooklyn, Queens, Buffalo, and Rochester. Search by ZIP code or city below to find the closest one, or filter by product type if you are after a specific format.
Market Insights Snapshot
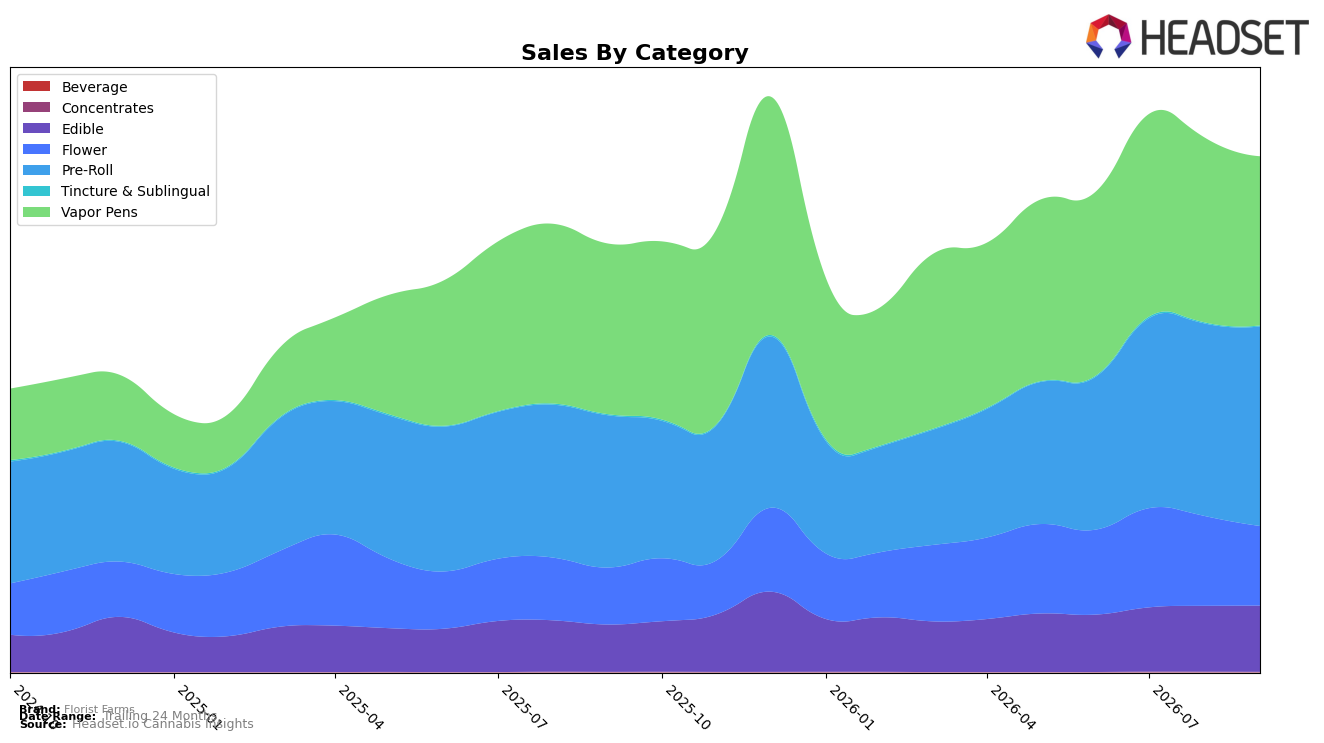
Florist Farms concentrated sales in Pre-Roll at 38.73% share with 31.19% year-over-year growth and 3.69% month-over-month, while Vapor Pens held 32.82% share but declined -0.87% year-over-year and -8.49% month-over-month; Flower rose 39.78% year-over-year yet slipped -11.42% month-over-month at 15.42% share, and Edible advanced 40.10% year-over-year with a modest 0.53% month-over-month gain at 12.82% share. Ultra-niche formats contracted simultaneously, with Tincture & Sublingual down -12.40% year-over-year and -12.88% month-over-month at 0.15% share, and Concentrates down -29.43% month-over-month despite a 7.68% year-over-year uptick at 0.06% share; combined with a -19.08% brand average price change and a 20.43% brand sales year-over-year increase, the mix points to volume-led gains anchored in Pre-Roll depth. The pattern implies Florist Farms is reallocating demand toward lower-priced, high-velocity units to compound share in Pre-Roll while tolerating Vapor Pens and Flower month-over-month volatility to keep total growth positive.
Holding rank 4 in Pre-Roll within New York alongside a 31.19% category year-over-year lift and 3.69% month-over-month growth suggests Florist Farms is closer to a scale position in its lead category than in its trailing formats where month-over-month declines of -8.49% in Vapor Pens and -11.42% in Flower could dilute basket trade-up. With Edible up 40.10% year-over-year but only 12.82% share, and an average price at $31.13 against category prices at $26.36 in Pre-Roll and $42.17 in Vapor Pens, the price architecture indicates a deliberate bridge strategy: lean into Pre-Roll rank efficiency while using Edible stability to buffer seasonal softness in inhalables, implying near-term share defense in Pre-Roll and selective pruning in low-penetration formats.
Competitive Landscape
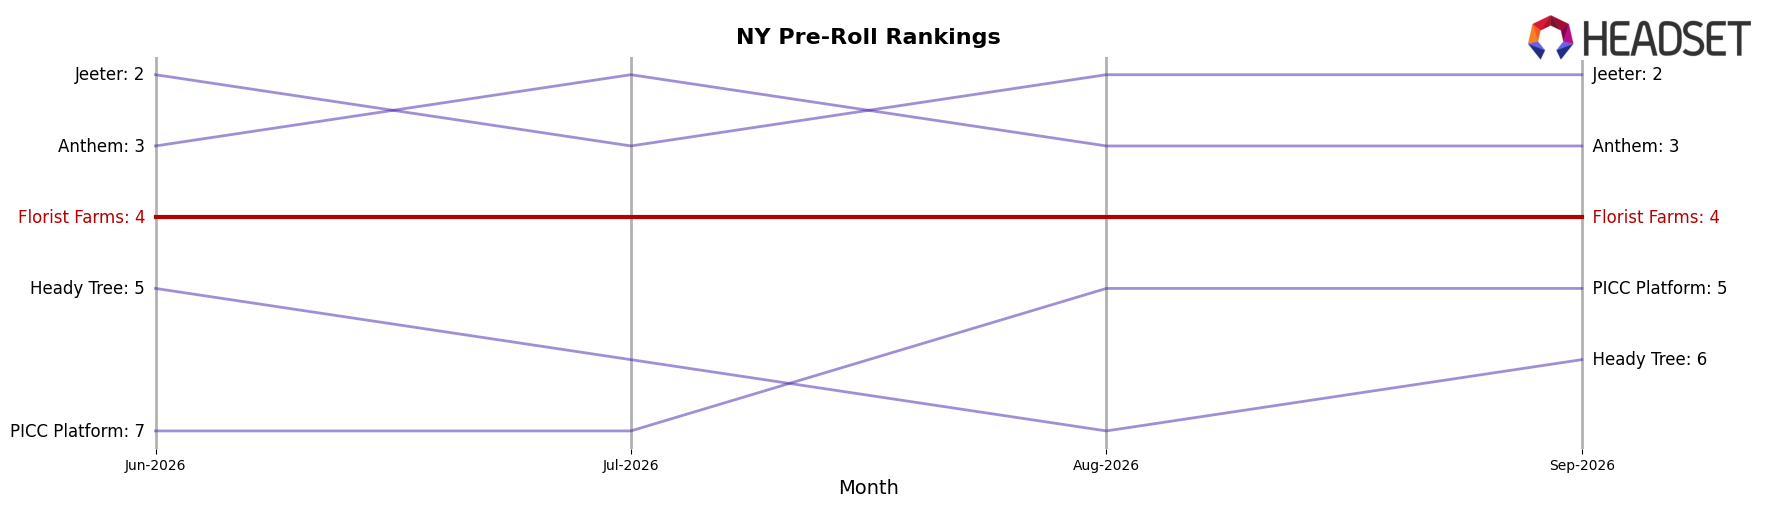
Florist Farms sits at rank #4 in New York Pre-Roll in September 2026, unchanged from #4 year over year, and flat versus three months ago at #4, while its historical peak was #3 in April 2025—together these positions indicate stability but no upward momentum. In contrast, Jeeter advanced from #6 to #2 alongside a 122.5% year-over-year sales lift, and Anthem surged from #22 to #3 with a 381.5% increase, whereas category leader Ruby Farms held #1 year over year with a 14.4% gain; meanwhile, PICC Platform jumped from #54 to #5 on 919.6% growth, tightening pressure directly below. The pattern implies that holding #4 while adjacent rivals post triple-digit gains raises the risk of being displaced unless Florist Farms converts its steady rank into share-accretive moves.
Notable Products
The steepest decline came from Candy Jack Live Resin Infused Pre-Roll 5-Pack (2.5g), down 19.6% month over month while sliding to rank 3, even as Sleep - THC/CBN 1:1 Bedtime Blueberry Gummies 10-Pack (100mg THC, 100mg CBN) grew 7.6% and held rank 1. Happy - CBC/THC 1:1 Strawberry Lemonade Gummies 10-Pack (100mg CBC, 100mg THC) fell 12.8% to rank 2, while Blue Dream Live Resin Cartridge (1g) eased 1.5% at rank 5. Pre-Rolls occupy four of the top ten with mixed momentum as Dutch Hawaiian Infused Pre-Roll 5-Pack (2.5g) dipped 2.2% at rank 4 and Witches Brew Live Resin Infused Pre-Roll 5-Pack (2.5g) declined 11.1% at rank 6, indicating assortment risk concentrated in infused formats even as the leading sleep edible anchors demand with approximately $115,892 in September 2026.
Top Selling Cannabis Brands






Data for this report comes from real-time sales reporting by participating cannabis retailers via their point-of-sale systems, which are linked up with Headset’s business intelligence software. Headset’s data is very reliable, as it comes digitally direct from our partner retailers. However, the potential does exist for misreporting in the instance of duplicates, incorrectly classified products, inaccurate entry of products into point-of-sale systems, or even simple human error at the point of purchase. Thus, there is a slight margin of error to consider. Brands listed on this page are ranked in the top twenty within the market and product category by total retail sales volume.

