Jun-2026
Sales
Trend
6-Month
Product Count
SKUs
Avg Price
YoY Sales Change
YoY Price Change
Market Insights Snapshot
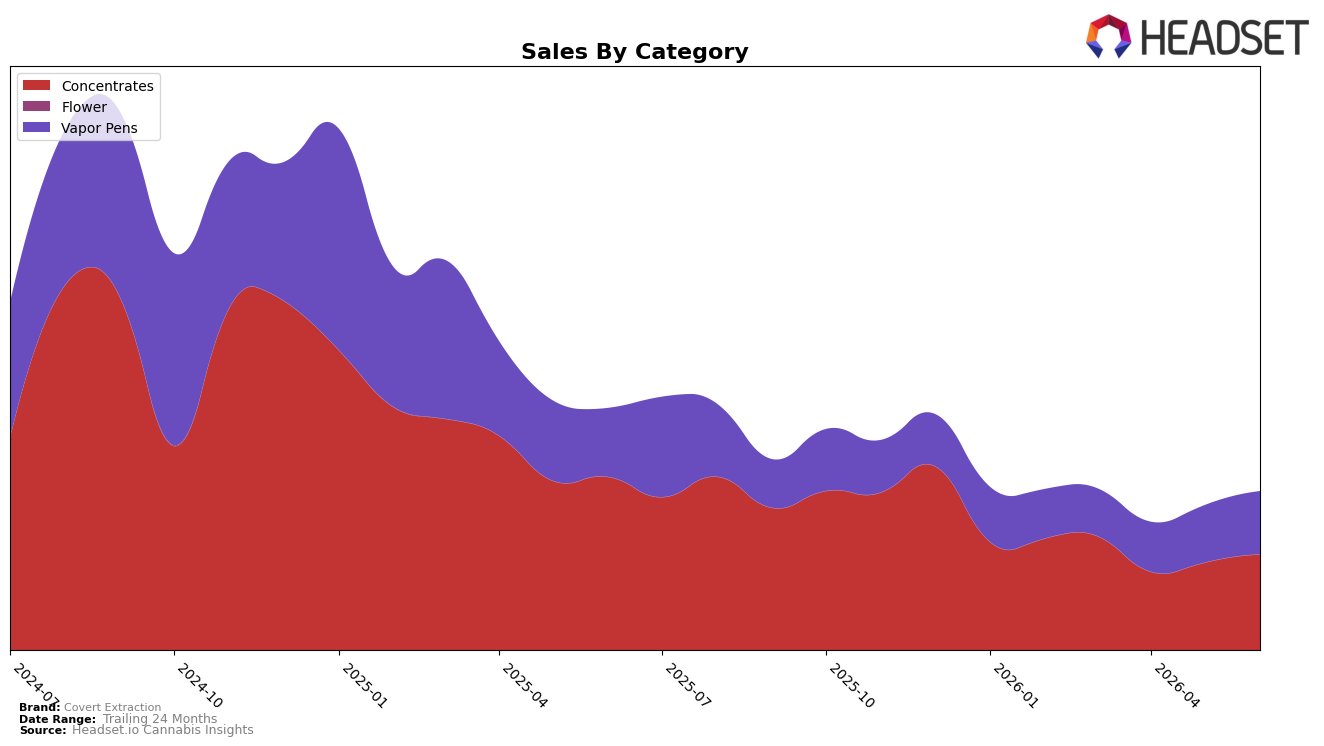
Covert Extraction’s June 2026 mix is concentrated in two categories: Concentrates at 60.20% share and Vapor Pens at 39.80% share, with Concentrates down 44.89% year over year but up 9.55% month over month, while Vapor Pens declined 8.40% year over year and rose 9.94% month over month. The brand’s average price rose 37.57% year over year to $24.85, while overall brand sales fell 34.50% year over year, indicating that price elevation coincided with volume contraction even as both categories posted mid‑single‑digit to high‑single‑digit month‑over‑month lifts. The pattern implies a mix anchored in Concentrates that is recovering sequentially but remains pressured annually, with Vapor Pens providing comparatively smaller annual drag and similar monthly momentum.
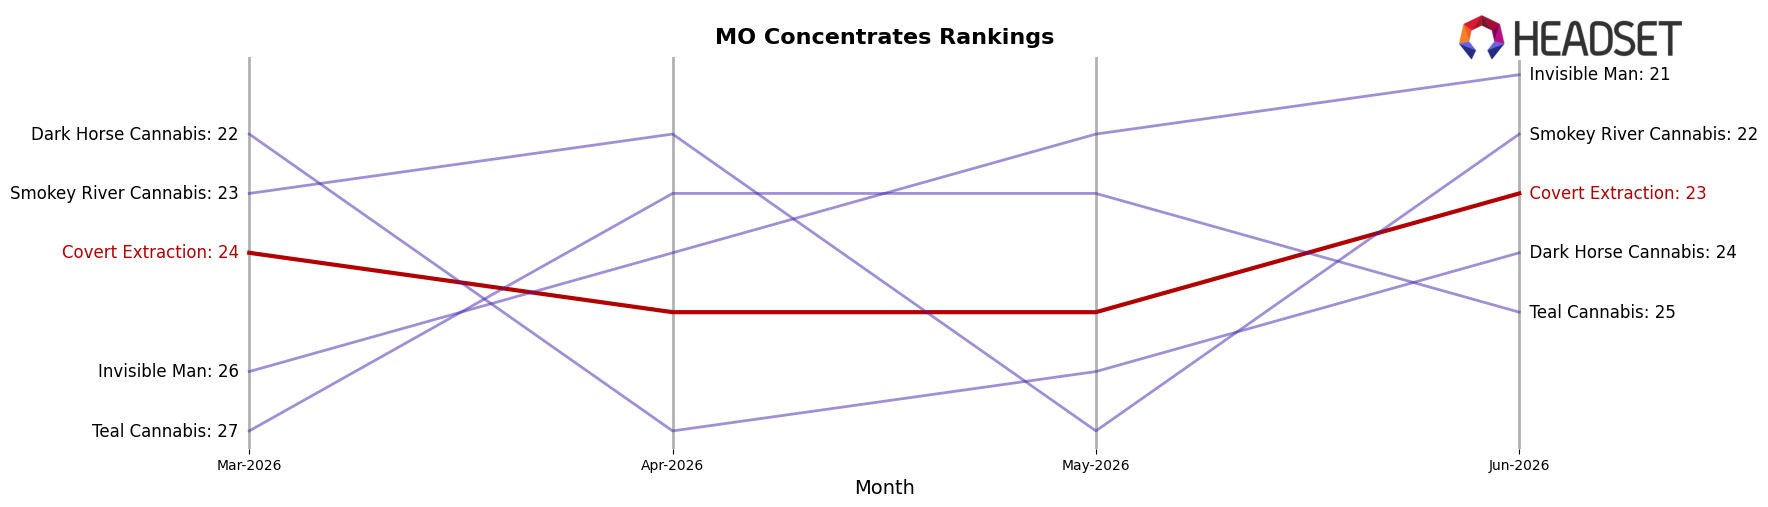
In Missouri Concentrates, Covert Extraction held rank 23 in June 2026, a position consistent with a category where year‑over‑year sales for the brand fell 44.89% while month‑over‑month sales rose 9.55%; this contrasts with Vapor Pens’ 8.40% year‑over‑year decline and 9.94% month‑over‑month gain. With Concentrates still the majority at 60.20% share and priced below the brand’s Vapor Pens average ($23.29 vs. $27.66), the brand is leaning on a lower‑price anchor while relying on Vapor Pens for relatively lighter annual erosion, suggesting a positioning shift toward defending core Concentrates presence at rank 23 while nudging incremental mix toward Vapor Pens to moderate annual declines.
Competitive Landscape
Covert Extraction sits at rank #23 in June 2026, down 4 positions year over year from #19, while holding roughly steady versus March 2026 at #24; that downward YoY move contrasts with Vibe Cannabis (MO) holding #1 with a 0-position YoY change and a 20.96% sales lift, and Proper Cannabis rising from #5 to #2 alongside a 13.16% YoY increase. The gap at the top widened further as Sinse Cannabis advanced from #9 to #3 with 53.21% YoY growth and Robust moved from #11 to #4 with 94.75% YoY growth, while Covert Extraction remains 11 ranks below its December 2024 peak of #12; this trajectory implies the brand’s competitive position is slipping relative to faster-advancing leaders and will require share-capturing moves to avoid further rank erosion.
Notable Products
Twisted Citrus Botanical Terpene Distillate Cartridge (1g) posted the standout surge in June 2026 with +117.5% month over month and jumped into rank 2, outpacing Peach Botanical Terpene Flavored Distillate Cartridge (1g) at rank 4 with +59.8% and Tropicana Cookies Botanical Terpene Distillate Cartridge (1g) at rank 3 with +51.6%. Strawberry Kiwi Distillate Cartridge (1g) countered the category upswing with a -28.9% drop while holding rank 10, and Melted Strawberry Sugar Wax (1g) slid -11.1% yet still led the board at rank 1. Four of the top ten are Vapor Pens, concentrating ranks 2–4 and 6, and that clustering alongside a single-month revenue peak near $10.2k for Melted Strawberry Sugar Wax (1g) implies the mix is tilting from legacy concentrates toward flavor-led cartridges as the primary volume engine.
Top Selling Cannabis Brands
Data for this report comes from real-time sales reporting by participating cannabis retailers via their point-of-sale systems, which are linked up with Headset’s business intelligence software. Headset’s data is very reliable, as it comes digitally direct from our partner retailers. However, the potential does exist for misreporting in the instance of duplicates, incorrectly classified products, inaccurate entry of products into point-of-sale systems, or even simple human error at the point of purchase. Thus, there is a slight margin of error to consider. Brands listed on this page are ranked in the top twenty within the market and product category by total retail sales volume.

