Jun-2026
Sales
Trend
6-Month
Product Count
SKUs
Avg Price
YoY Sales Change
YoY Price Change
Market Insights Snapshot
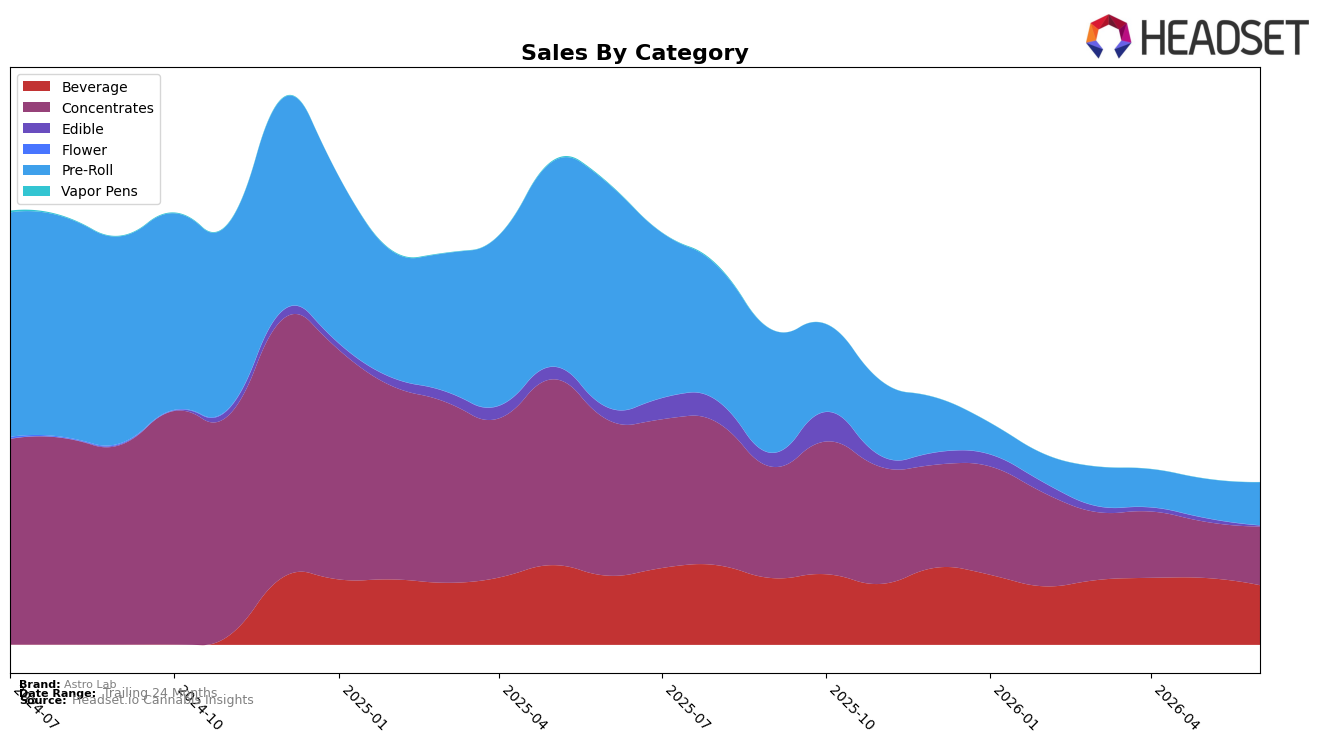
Astro Lab’s June 2026 mix is concentrated in Beverage at 36.81% share with year-over-year decline of 13.81% and month-over-month decline of 10.93%, while Concentrates holds 36.23% share with a 62.36% YoY drop but a 4.36% MoM uptick. Pre-Roll accounts for 26.50% share with an 80.88% YoY decline alongside a 10.07% MoM increase, and Edible sits at 0.46% share with a 93.77% YoY fall and a 78.29% MoM slide. With total brand sales down 64.97% YoY and average price down 30.03% YoY to $13.52, the pattern implies a tactical pivot toward stabilizing volume in Concentrates and Pre-Roll month-over-month while Beverage remains the anchor by share despite concurrent YoY and MoM contraction.
Astro Lab’s position leans on Beverage scale yet is exposed to price compression, as the category with the lowest average price at $7.19 is shrinking 10.93% MoM while higher-priced Concentrates at $32.63 grew 4.36% MoM; this divergence suggests margin recapture potential if mix shifts continue away from Beverage’s 36.81% share toward Concentrates’ 36.23% share. Pre-Roll’s 10.07% MoM growth from a base that fell 80.88% YoY indicates re-entry rather than expansion, implying near-term share volatility rather than durable penetration, and Edible’s 78.29% MoM retreat with 0.46% share signals rationalization of fringe SKUs. Taken together with a Beverage category rank of 14 in Ontario, the pattern implies Astro Lab is repositioning from a price-led Beverage footprint toward selective higher-ticket recovery bets, accepting lower breadth to stabilize contribution mix.
Competitive Landscape
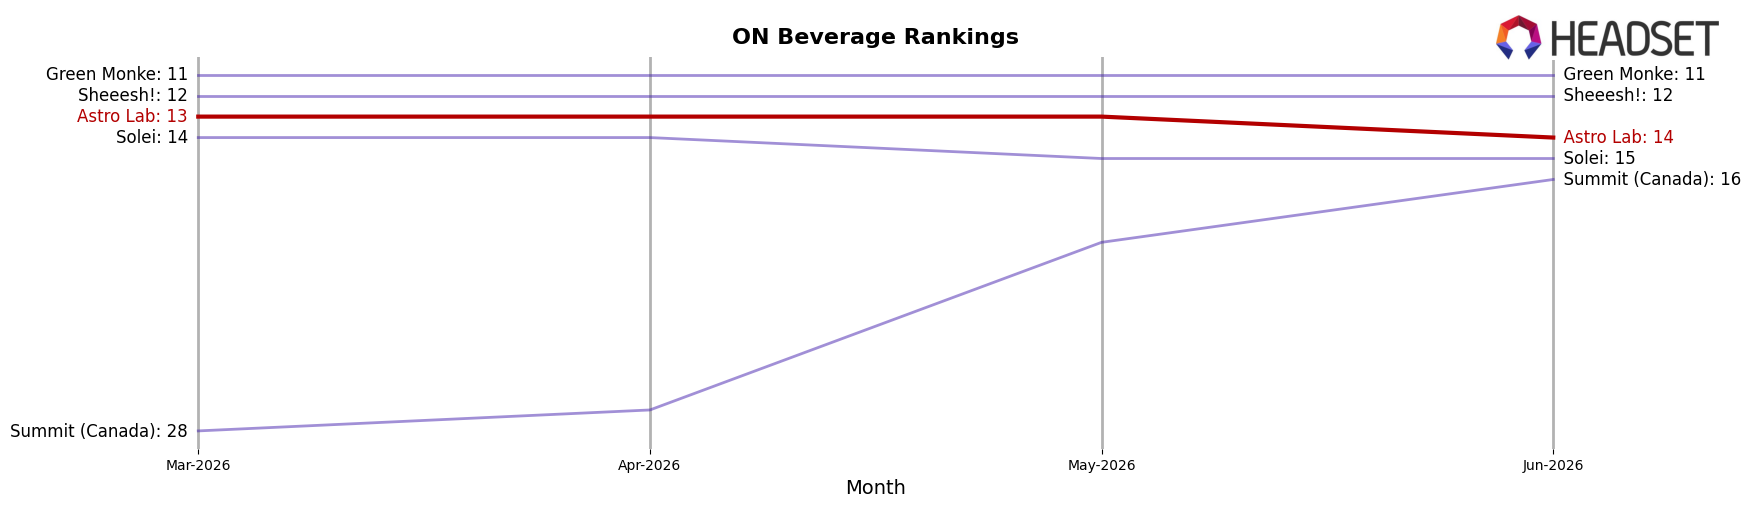
Astro Lab sits at #14 in ON Beverage in June 2026, improving 2 ranks YoY from #16, but slipping 1 spot from March 2026’s #13 while remaining below its February 2026 peak of #12; against this, XMG held #1 with a -37.0% YoY sales change and TeaPot climbed from #10 to #5 on +129.5% YoY, indicating that Astro Lab’s modest rank recovery is occurring amid volatile leader declines and aggressive mid-tier gains, implying a stable but pressured trajectory that requires share defense rather than expecting organic lift from category tides.
Notable Products
Galactic Sour Live Rosin Gummy (10mg) posted the steepest movement in June 2026 with a -75.2% MoM slide while sitting at rank 9, and Gummy Old School Hash (2g) similarly contracted by -21.4% at rank 3; together these declines imply edibles and legacy concentrates are shedding momentum as buyers shift away from non-inhalables. Interstellar Live Rosin Cream Soda (10mg THC, 355ml) retained rank 1 despite a -13.6% MoM change, while Interstellar Rocket Lime Live Rosin Soda (10mg THC, 355ml) held rank 2 with a -7.3% MoM dip, signaling beverages remain leading traffic drivers even as absolute revenue of $52,356 softens. Four of the top ten are Pre-Roll SKUs, with Pineapple Orange Peel Live Rosin & Moon Dusted Infused Pre-Roll 5-Pack (2.5g) surging +49.4% at rank 4 against Guavacot Kush Live Rosin Infused Pre-Roll 3-Pack (1.5g) at +47.4% and Astro Sampler Live Rosin Infused Pre-Roll 3-Pack (1.5g) at -48.3%, indicating the pre-roll lane is bifurcating toward flavor-forward infusions while variety packs lag. Overall, the mix points to Astro Lab leaning into infused pre-rolls and maintaining beverage leadership, while trimming exposure to edibles and older concentrate formats.
Top Selling Cannabis Brands
Data for this report comes from real-time sales reporting by participating cannabis retailers via their point-of-sale systems, which are linked up with Headset’s business intelligence software. Headset’s data is very reliable, as it comes digitally direct from our partner retailers. However, the potential does exist for misreporting in the instance of duplicates, incorrectly classified products, inaccurate entry of products into point-of-sale systems, or even simple human error at the point of purchase. Thus, there is a slight margin of error to consider. Brands listed on this page are ranked in the top twenty within the market and product category by total retail sales volume.

