Nov-2025
Sales
Trend
6-Month
Product Count
SKUs
Avg Price
YoY Sales Change
YoY Price Change
Market Insights Snapshot
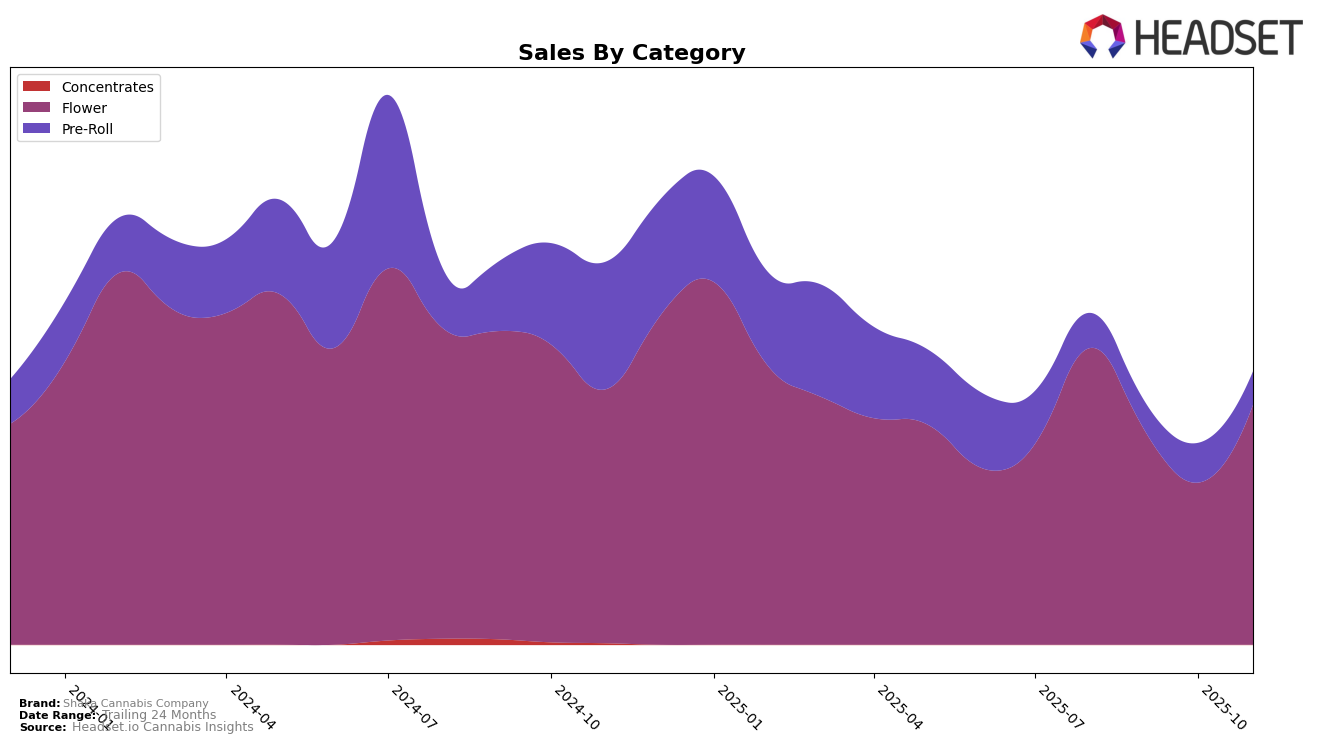
In Massachusetts, Shaka Cannabis Company has shown a notable comeback in the Flower category, climbing from a rank of 44 in October 2025 to 27 in November 2025. This resurgence is accompanied by a significant increase in sales, which rose from approximately $290,381 in October to $464,866 in November. This upward movement indicates a strong recovery and suggests that the brand has managed to capture consumer interest effectively in this category. In contrast, their performance in the Pre-Roll category remains less impressive, with rankings fluctuating between 67 and 70, failing to break into the top 30. This suggests that while they have a strong foothold in the Flower category, their Pre-Roll offerings might not be resonating as well with consumers in Massachusetts.
Meanwhile, in Michigan, Shaka Cannabis Company's performance in the Flower category has been less consistent. After being ranked 51 in August 2025, they fell out of the top 30 by October, highlighting a significant challenge in maintaining market presence in this state. By November, they reappeared at rank 81, which suggests some recovery but still indicates a need for strategic adjustments to improve their standing. The absence of a ranking in October could be seen as a setback for the brand's visibility and competitiveness in Michigan's Flower market, pointing to potential issues in either distribution, marketing, or product appeal that might need addressing.
Competitive Landscape
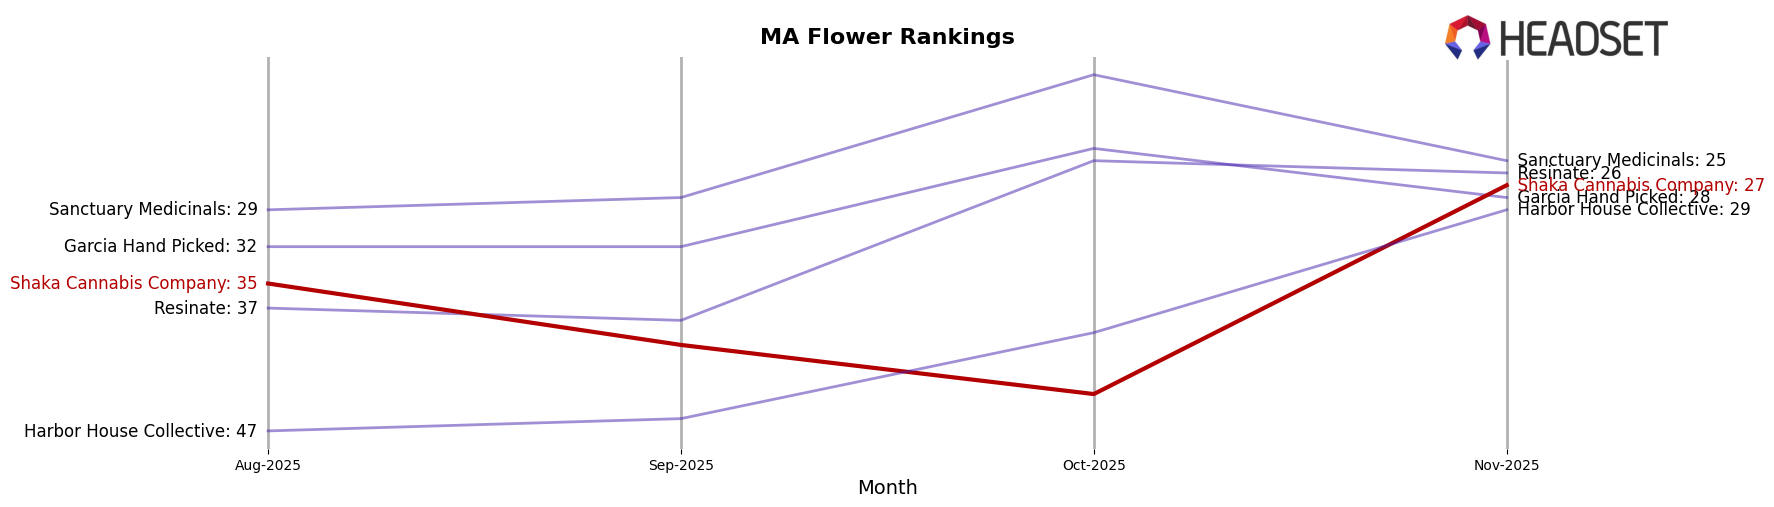
In the competitive landscape of the Massachusetts flower category, Shaka Cannabis Company has experienced notable fluctuations in its ranking and sales over the past few months. In August 2025, Shaka Cannabis Company was ranked 35th, but it saw a decline to 40th in September and further dropped to 44th in October. However, November brought a significant recovery as it climbed to 27th place. This upward movement in November aligns with a rebound in sales, which increased from a low in October to levels comparable with competitors. For instance, Garcia Hand Picked maintained a relatively stable position, ranking 32nd in August and September, and fluctuating between 24th and 28th in the following months, consistently outperforming Shaka in sales. Meanwhile, Sanctuary Medicinals showed strong performance, ranking as high as 18th in October, indicating a significant lead in both rank and sales. The data suggests that while Shaka Cannabis Company faced challenges in maintaining its rank, its recent recovery indicates potential for growth, especially if it continues to capitalize on the momentum seen in November.
Notable Products
In November 2025, Banana Cake #20 (3.5g) emerged as the top-selling product for Shaka Cannabis Company, climbing from the second rank in October to secure the first position with impressive sales of 8204 units. Cadillac Rainbows (3.5g) made a significant entry by ranking second, despite not being ranked in the previous months. Chocolate Milk (3.5g) debuted at the third position, indicating strong initial sales. Chocolate Milk Pre-Roll (1g) experienced a slight drop, moving from first place in October to fourth in November. Meanwhile, Street Tarts (3.5g) entered the rankings at fifth place, showcasing its growing popularity.
Top Selling Cannabis Brands
Data for this report comes from real-time sales reporting by participating cannabis retailers via their point-of-sale systems, which are linked up with Headset’s business intelligence software. Headset’s data is very reliable, as it comes digitally direct from our partner retailers. However, the potential does exist for misreporting in the instance of duplicates, incorrectly classified products, inaccurate entry of products into point-of-sale systems, or even simple human error at the point of purchase. Thus, there is a slight margin of error to consider. Brands listed on this page are ranked in the top twenty within the market and product category by total retail sales volume.

