.svg)


Where to Buy
Six Labs is stocked at 55 licensed dispensaries across Michigan and Illinois, 52 of them in Michigan, with the deepest coverage in Monroe, Ann Arbor, Grand Rapids, Kalamazoo, and Muskegon. Search by ZIP code or city below to find the closest one, or filter by product type if you are after a specific format.
Market Insights Snapshot
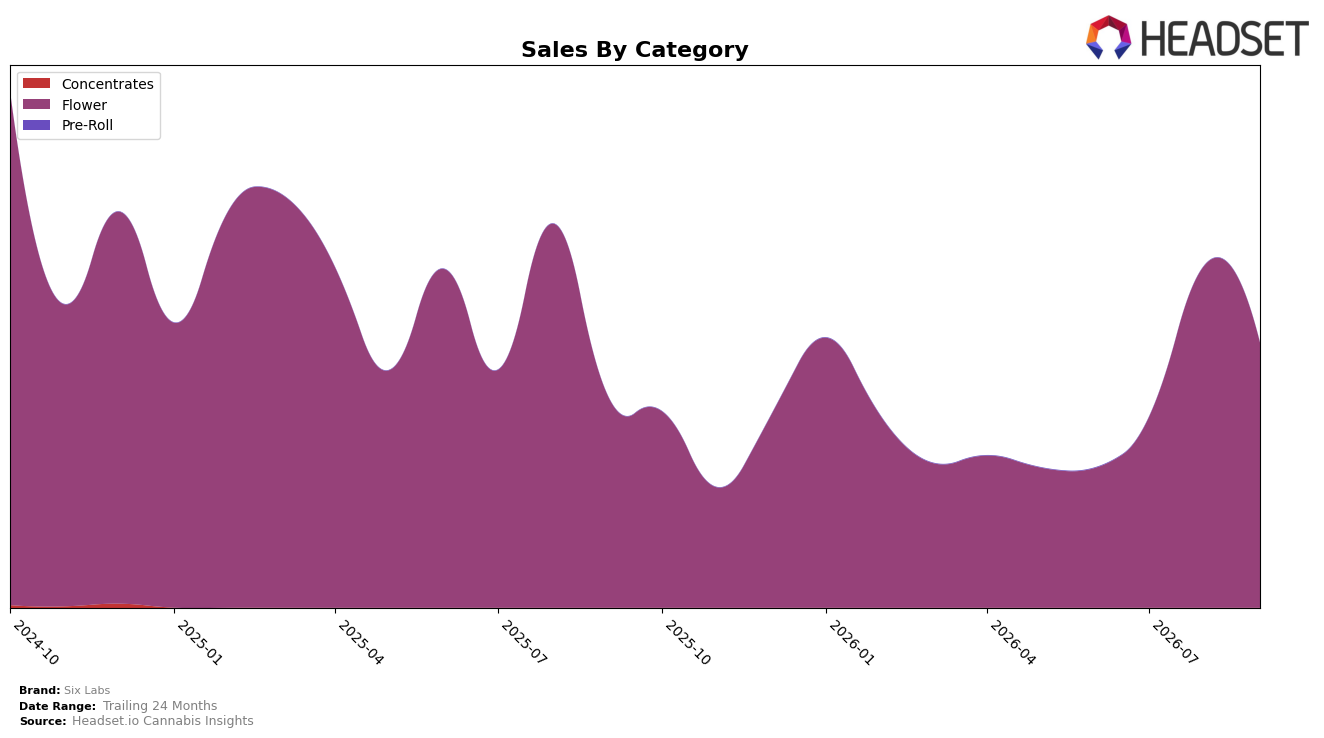
In September 2026, Six Labs concentrated entirely in Flower, with category mix at 100.0% share and an average item price down 24.5% year over year alongside sales up 25.5% YoY. Month over month, sales in Flower declined 22.6% while share remained at 100.0%, indicating the pullback was volume or pricing-driven within a single-category footprint rather than mix rotation. The brand held a rank of 31 in Flower in Michigan, and the combination of a 25.5% YoY lift with a 22.6% MoM step-down implies momentum remains contingent on discount-enabled demand within a narrow category scope.
The full reliance on Flower (100.0% of sales) during September 2026, paired with a 24.5% YoY price compression and a 22.6% MoM sales dip, implies a price-elastic customer base and limited insulation from seasonal or promotional swings. Holding rank 31 in Michigan Flower while average price fell 24.5% and sales grew 25.5% YoY suggests positioning anchored in value access rather than breadth; without diversification into adjacent categories, the brand’s exposure to single-category price cycles remains elevated.
Competitive Landscape
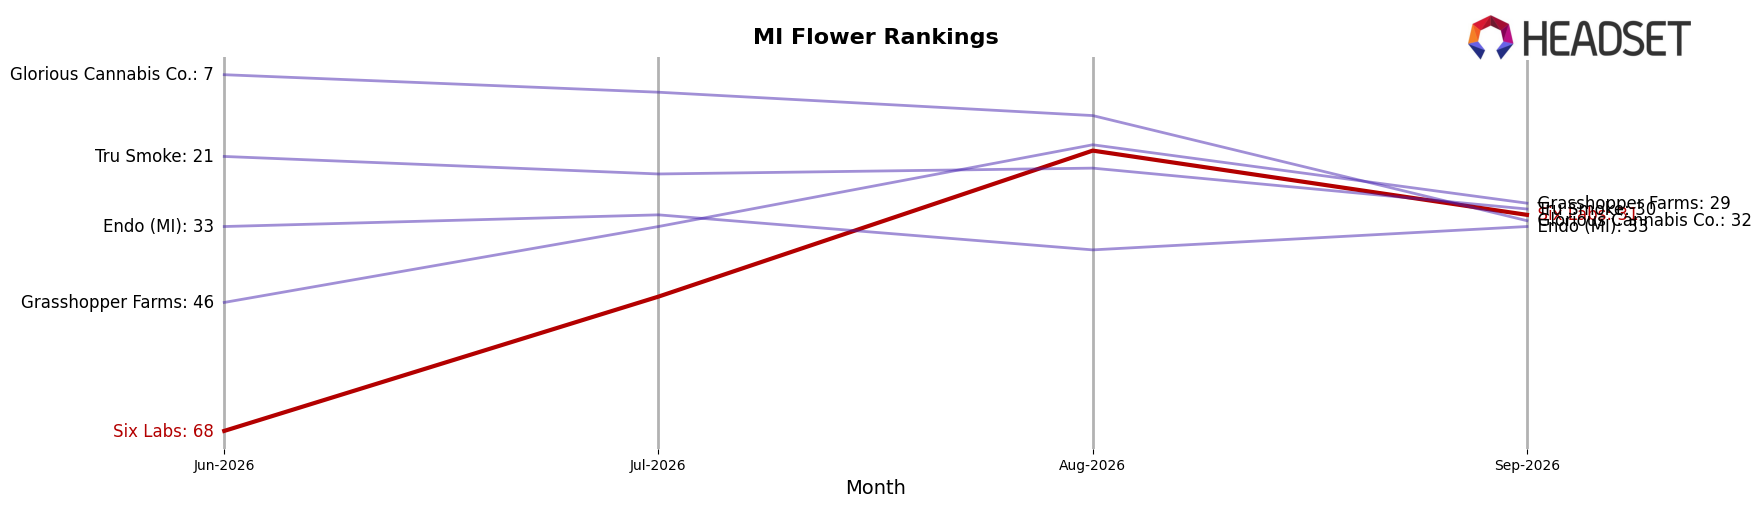
Six Labs sits at rank #31 in Michigan Flower for September 2026, improving 11 positions from #42 year over year while rising 37 spots from #68 since June 2026; however, the brand remains 17 places below its peak of #14 set in October 2024, indicating recovery but not a return to prior position. In contrast, High Minded held #1 both this year and last despite a -3.3% YoY sales change, and Play Cannabis advanced from #7 to #2 with a 33.3% YoY increase, while NOBO surged from #19 to #4 alongside a 188.3% YoY climb, pointing to faster upward mobility among leaders than Six Labs’ 11-rank YoY gain. The pattern implies that Six Labs’ trajectory—material rank recovery within three months yet still 17 ranks off its October 2024 peak—signals mid-pack momentum that will require outsized share capture to close the gap on top-tier climbers.
Notable Products
Garlic Crusher (28g) delivered the most dramatic move in September 2026 with an 862% month-over-month surge that vaulted it to rank 1, while Munyunz (1g) followed with a 681% gain to rank 2. Honey Pot (Bulk) also accelerated by 264% to rank 3, and Yellow Zushi (Bulk) inched up 11% at rank 4 even as Don Mega Smalls (28g) fell 44% to rank 9. With all top-10 entries concentrated in Flower and three SKUs posting triple-digit MoM gains alongside one double-digit decline, the mix signals a pivot toward large, volatility-driven wins in Flower that favor rapidly scaling hero SKUs over steady breadth.
Top Selling Cannabis Brands






Data for this report comes from real-time sales reporting by participating cannabis retailers via their point-of-sale systems, which are linked up with Headset’s business intelligence software. Headset’s data is very reliable, as it comes digitally direct from our partner retailers. However, the potential does exist for misreporting in the instance of duplicates, incorrectly classified products, inaccurate entry of products into point-of-sale systems, or even simple human error at the point of purchase. Thus, there is a slight margin of error to consider. Brands listed on this page are ranked in the top twenty within the market and product category by total retail sales volume.

