Jun-2026
Sales
Trend
6-Month
Product Count
SKUs
Avg Price
YoY Sales Change
YoY Price Change
Market Insights Snapshot
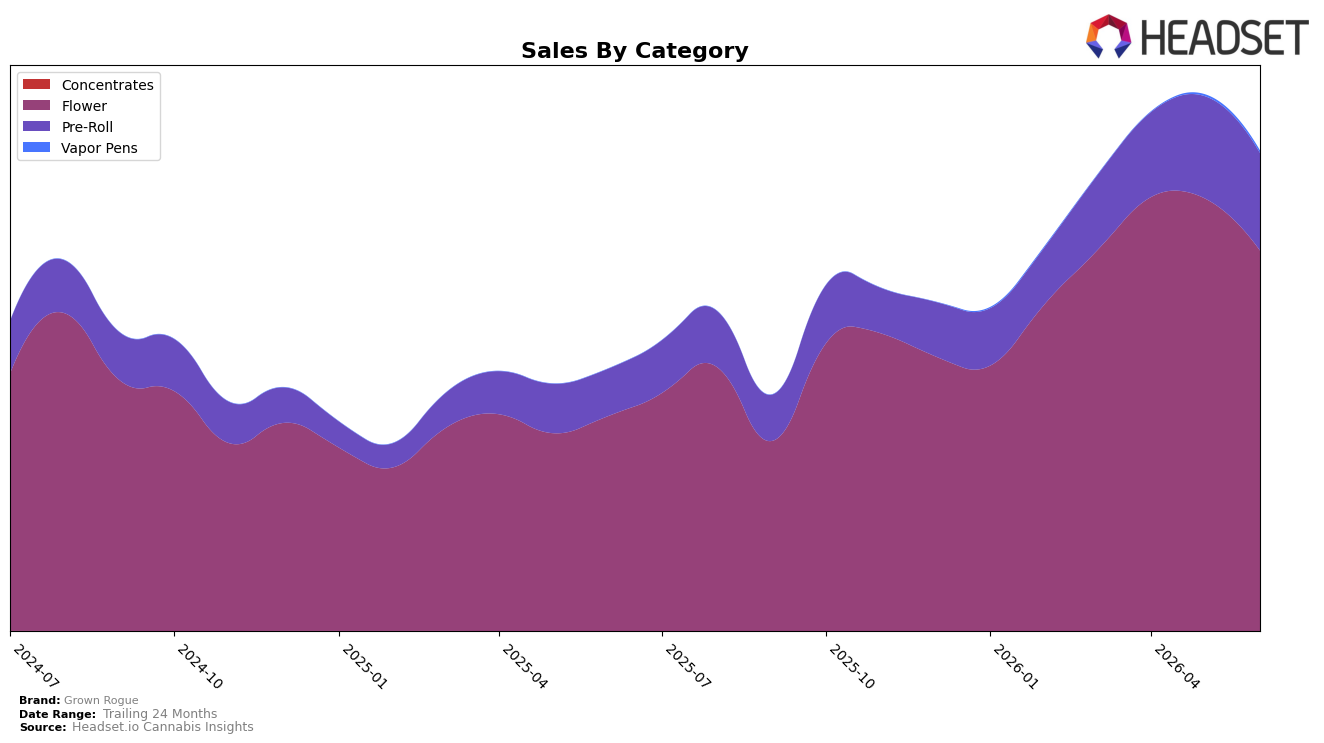
Grown Rogue concentrated 79.27% of June 2026 sales in Flower with a year-over-year increase of 77.15% but a month-over-month decline of 12.08%, while Pre-Roll held 20.27% share with 106.90% YoY growth and a 4.53% MoM dip; Vapor Pens remained a niche at 0.45% share with a 35.81% MoM rise and no YoY baseline. Despite an average price decline of 17.68% YoY to $12.69, overall brand sales rose 83.32% YoY, indicating volume-led expansion; in parallel, the Flower rank at #2 in Oregon signals category leadership even as monthly softness suggests near-term demand normalization.
The mix shift toward high-growth Pre-Rolls (up 106.90% YoY at 20.27% share) alongside a Flower-heavy base (79.27% share, #2 rank in Oregon) implies a barbell positioning: defending scale in Flower while using lower-priced, faster-turn Pre-Rolls to acquire baskets under a 17.68% YoY price reset. The 35.81% MoM uptick in Vapor Pens from a 0.45% base suggests a test-and-learn entry that can hedge against Flower’s 12.08% MoM dip; together these shifts imply Grown Rogue is trading mix elasticity for market share now, then converting with cross-category breadth as volumes compound.
Competitive Landscape
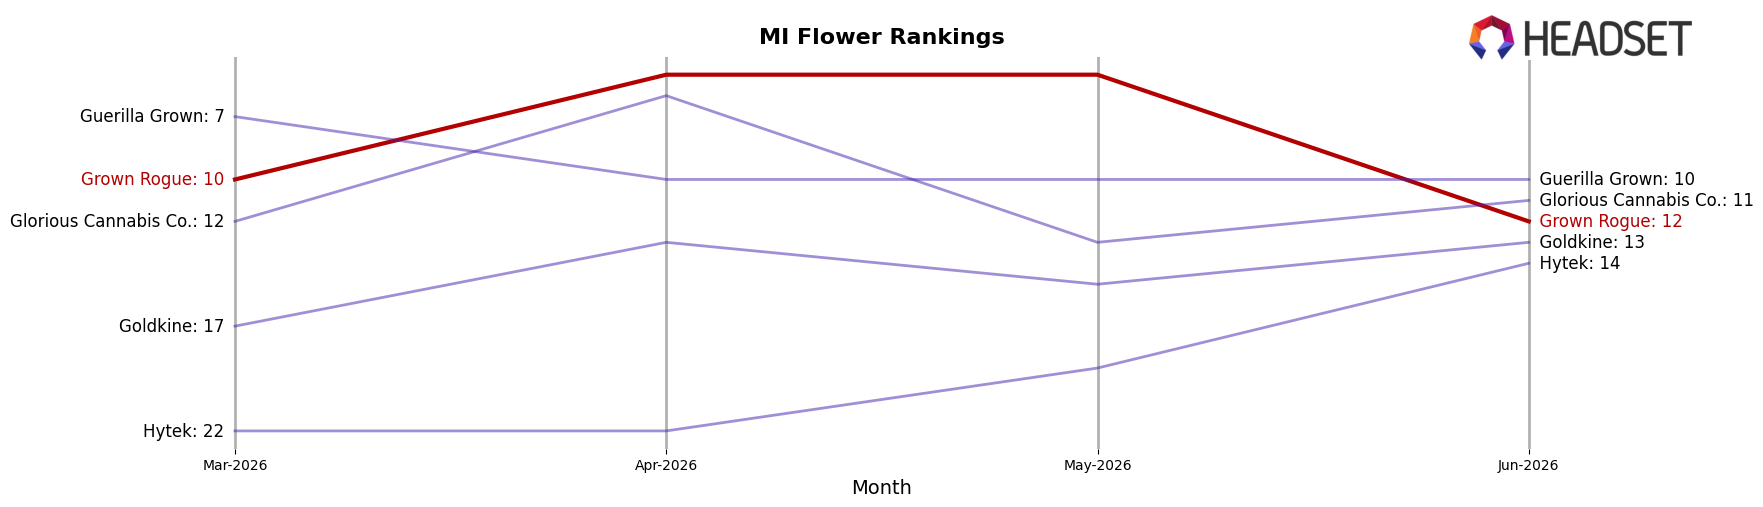
Grown Rogue sits at rank #12 in MI Flower in June 2026, improving 10 positions from #22 year over year, but slipping 2 spots from #10 three months ago and down 7 places from its peak at #5 in May 2026; in contrast, Goodlyfe Farms climbed from #5 to #2 with a 44.1% YoY sales increase while High Minded held #1 despite a 13.7% YoY decline, indicating that Grown Rogue’s upward YoY rank shift is real but its recent 2-rank pullback suggests momentum is moderating relative to faster-rising peers. The pattern implies Grown Rogue’s trajectory points to mid-tier consolidation unless it reverses the recent 2-rank slide and narrows the gap to leaders advancing multiple ranks year over year.
Notable Products
Blue Runtz (Bulk) posted the steepest decline at -55.2% month over month while sliding to rank 5, whereas Rainbow Runtz (1g) surged +55.6% to rank 1 with $104,985 in June 2026. Blue Runtz (3.5g) also fell -22.3% at rank 6, and Category 5 (Bulk) dropped -21.4% at rank 2, indicating that two Blue Runtz formats in the top ten contracted simultaneously while a single-gram SKU took the lead. With eight of the top ten positioned in Flower, the mix suggests Grown Rogue is tilting from bulk-heavy Blue Runtz reliance toward higher-velocity smaller units anchored by Rainbow Runtz (1g).
Top Selling Cannabis Brands
Data for this report comes from real-time sales reporting by participating cannabis retailers via their point-of-sale systems, which are linked up with Headset’s business intelligence software. Headset’s data is very reliable, as it comes digitally direct from our partner retailers. However, the potential does exist for misreporting in the instance of duplicates, incorrectly classified products, inaccurate entry of products into point-of-sale systems, or even simple human error at the point of purchase. Thus, there is a slight margin of error to consider. Brands listed on this page are ranked in the top twenty within the market and product category by total retail sales volume.

