May-2026
Sales
Trend
6-Month
Product Count
SKUs
Avg Price
YoY Sales Change
YoY Price Change
Market Insights Snapshot
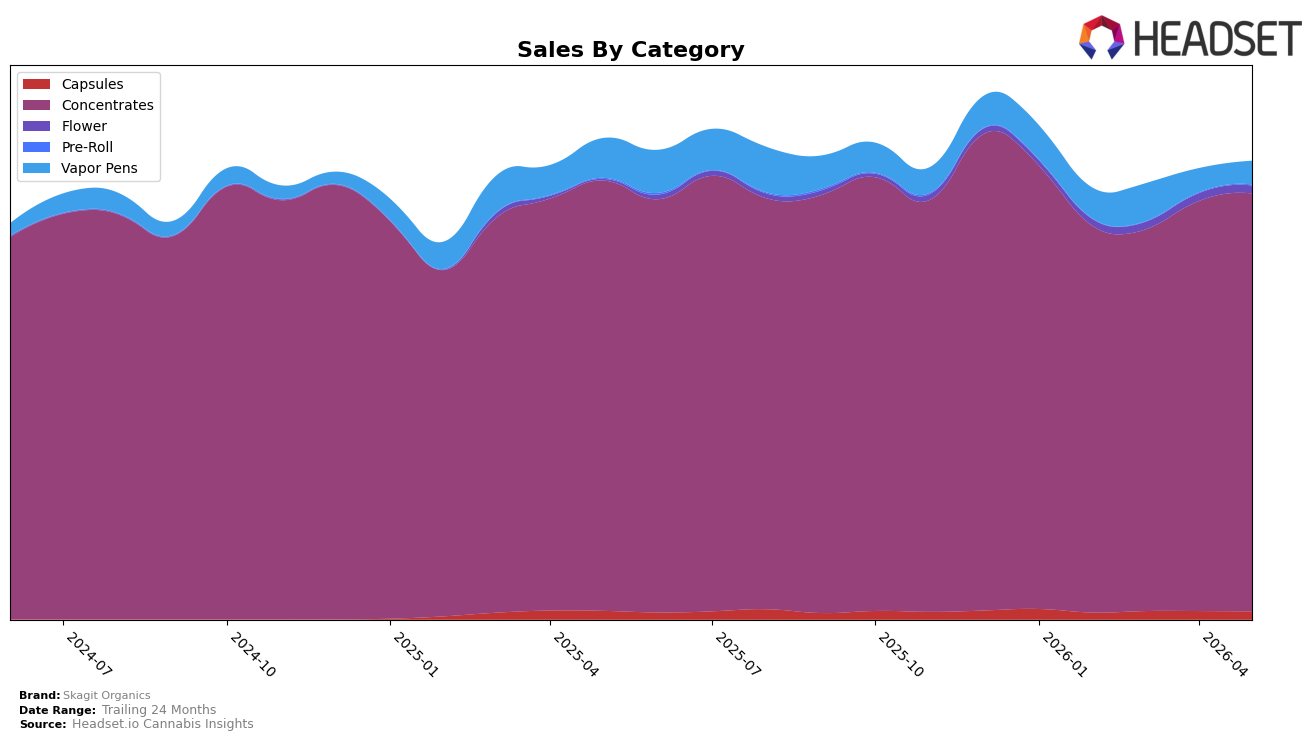
Skagit Organics concentrated its May 2026 mix in Concentrates at 91.40% share with a 1.96% month-over-month gain despite a 2.87% year-over-year decline, while Vapor Pens fell to 5.09% share with a 2.39% MoM drop and a 41.13% YoY contraction; the brand’s small Pre-Roll presence at 0.13% share surged 56.71% MoM and 4.65% YoY even as Capsules at 1.74% share slipped 4.05% MoM and 6.20% YoY. Flower rose to 1.64% share with a 0.42% MoM uptick and a 506.27% YoY jump, but the average price for the brand declined 8.29% YoY to $14.06, aligning with a Concentrates average price of $13.81 and Vapor Pens at $18.53. The pattern implies the May 2026 headline is concentration risk: modest MoM stability is anchored in Concentrates, while double-digit YoY erosion in Vapor Pens and Capsules caps upside and forces volume to lean on a single category.
With Concentrates ranked 6th in Washington and holding over 90% of internal mix, the brand’s May 2026 positioning is that of a category specialist whose growth path depends on incremental share wins rather than breadth; the 1.96% MoM lift in Concentrates offsets only part of the brand’s 4.76% YoY sales decline as Vapor Pens’ 41.13% YoY slide drags the portfolio. The outsized 506.27% YoY increase in Flower and 56.71% MoM spike in Pre-Roll occur off sub-2% and sub-0.2% shares respectively, so even sharp percentage gains have limited impact versus a Concentrates base exceeding 91%; this implies near-term leverage remains in pricing and distribution within Concentrates, while small but growing Flower and Pre-Roll can serve as optionality rather than primary volume drivers.
Competitive Landscape
Skagit Organics is ranked #6 in WA Concentrates in May 2026, improving 4 places from #10 in May 2025, and edging up 1 spot from #7 in February 2026; this matches its peak rank of #6 in May 2026 while still trailing the top 5 by a single position. Among competitors, Constellation Cannabis advanced from #8 to #3 alongside a 49.6% year-over-year sales change, while Oleum Extracts (Oleum Labs) slipped from #4 to #5 with a -4.5% year-over-year sales change, indicating Skagit Organics’ upward rank movement of 4 places year over year is occurring amid mixed competitor momentum and implies the brand is transitioning from mid-pack to credible top-5 contention if the one-rank gap can be closed consistently.

Notable Products
9lb Hammer RSO Tanker (1g) posted the steepest decline in May 2026 at -18.7% MoM while falling to rank 4, and Grand Daddy Purple RSO Tanker (1g) also contracted -15.7% MoM at rank 5; together these drops contrast with Original - Blue Dream RSO (1g) rising 20.9% MoM to rank 1. Original - 9# Hammer RSO (1g) added 20.0% MoM at rank 3 while Original - Durban Poison RSO Tanker (1g) advanced 10.6% MoM to a share of rank 2, and Original - Cherry OG RSO Tanker (1g) gained 10.1% MoM at rank 7, indicating momentum concentrated in the Original line even as two Tanker SKUs retrenched. With eight of the top ten being RSO or RSO Tanker concentrates and only one Value entry at rank 6 with $3,605 in sales, the mix skews toward legacy Original formulations rather than value-tier or new variants. The pattern implies Skagit Organics is leaning into flagship RSO strains for volume while pruning or repositioning select Tanker formats that are giving up rank against faster-growing Original SKUs.
Top Selling Cannabis Brands
Data for this report comes from real-time sales reporting by participating cannabis retailers via their point-of-sale systems, which are linked up with Headset’s business intelligence software. Headset’s data is very reliable, as it comes digitally direct from our partner retailers. However, the potential does exist for misreporting in the instance of duplicates, incorrectly classified products, inaccurate entry of products into point-of-sale systems, or even simple human error at the point of purchase. Thus, there is a slight margin of error to consider. Brands listed on this page are ranked in the top twenty within the market and product category by total retail sales volume.

