Market Insights Snapshot
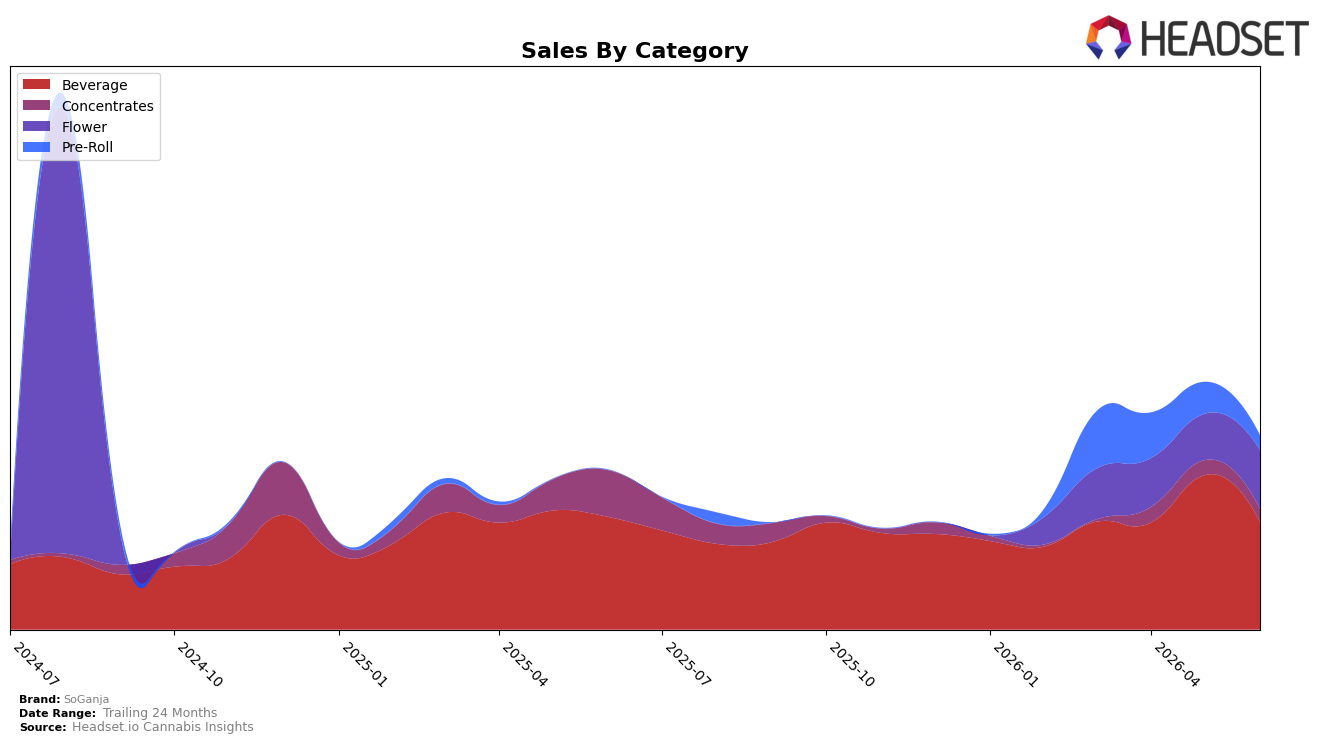
SoGanja’s mix in June 2026 tilted toward Beverage at 55.56% share, even as Beverage contracted by 30.41% month over month and 4.60% year over year, while Concentrates held 6.67% share with a 72.12% year-over-year drop and an 11.65% month-over-month decline. Offsetting that, Flower expanded to 30.21% share with a 27.01% month-over-month rise, whereas Pre-Roll slipped to 7.55% share with a 53.85% month-over-month decline; in aggregate, this reweights SoGanja toward categories with higher average prices, implying a pivot from volume-led Beverage to margin-accretive Flower as a stabilizer for June 2026.
The category shifts change positioning: Beverage’s average price of $15.60 contrasted with Flower at $97.11, and with SoGanja’s overall average price up 46.10% year over year alongside brand sales up 21.69% year over year, the growing Flower mix likely lifted realized price while cushioning Beverage’s month-over-month contraction of 30.41%. Maintaining Beverage leadership at rank 4 in Missouri while Flower gains 27.01% month over month indicates a barbell stance—protecting a mid-pack Beverage slot (rank 4) and reallocating toward premium-priced Flower—implying near-term resilience if Beverage softness persists and improved leverage in average selling price across June 2026.
Competitive Landscape
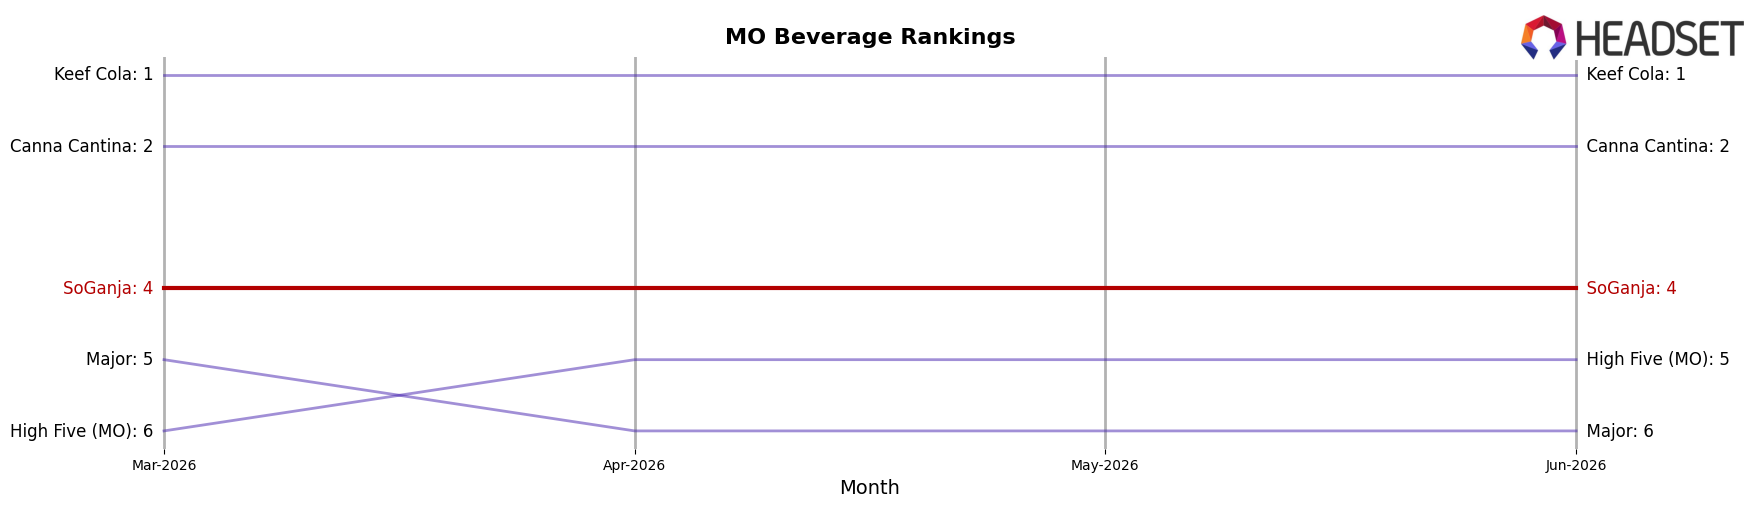
SoGanja sits at #4 in MO Beverage in June 2026 with no year-over-year rank change from #4, and no three-month movement from #4 to #4, while its peak was #3 in December 2024 before slipping back one position; meanwhile, Keef Cola held #1 year-over-year and remains #1 despite a -20.4% YoY sales change, and Illicit / Illicit Gardens climbed from #6 to #3 alongside a +73.8% YoY sales gain, placing upward pressure directly ahead of SoGanja. With High Five (MO) steady at #5 year-over-year while declining -9.8% YoY in sales, SoGanja’s static #4 versus a rising #3 competitor and a weakening #5 suggests a consolidation phase where holding share requires offense to retake the #3 peak rather than defense to avoid slippage.
Notable Products
Rocket Rootbeer x Burger Belts Live Rosin Soda (25mg THC, 12oz) posted the steepest decline at -52.7% month over month while sitting at rank 4 in June 2026, and Starberry Cream Live Rosin Soda (25mg, 12oz, 355ml) also fell -48.0% at rank 3, indicating a sharp retreat among live rosin formats. Blue Buzzberry (Fruit Cocktail #5) Soda (25mg THC, 12oz) led the lineup at rank 1 despite a -12.9% drop, while Galactic Grape x Mimosa Pie Live Rosin Soda (25mg THC, 12oz) slid -31.6% at rank 2, pointing to broad pressure across the top tier. Eight of the top ten are Beverage SKUs, and two new Blue Buzzberry and Frozen Bomb/Frozen Yoda live resin entries debuted in the top 10 without prior-month comps, implying a pivot toward variety within the same category rather than cross-category expansion. The pattern suggests SoGanja is consolidating around beverages and refreshing flavors to sustain share, even as live rosin price-sensitive units compress and the mix shifts toward live resin variants.
Top Selling Cannabis Brands
Data for this report comes from real-time sales reporting by participating cannabis retailers via their point-of-sale systems, which are linked up with Headset’s business intelligence software. Headset’s data is very reliable, as it comes digitally direct from our partner retailers. However, the potential does exist for misreporting in the instance of duplicates, incorrectly classified products, inaccurate entry of products into point-of-sale systems, or even simple human error at the point of purchase. Thus, there is a slight margin of error to consider. Brands listed on this page are ranked in the top twenty within the market and product category by total retail sales volume.

