Jun-2026
Sales
Trend
6-Month
Product Count
SKUs
Avg Price
YoY Sales Change
YoY Price Change
Market Insights Snapshot
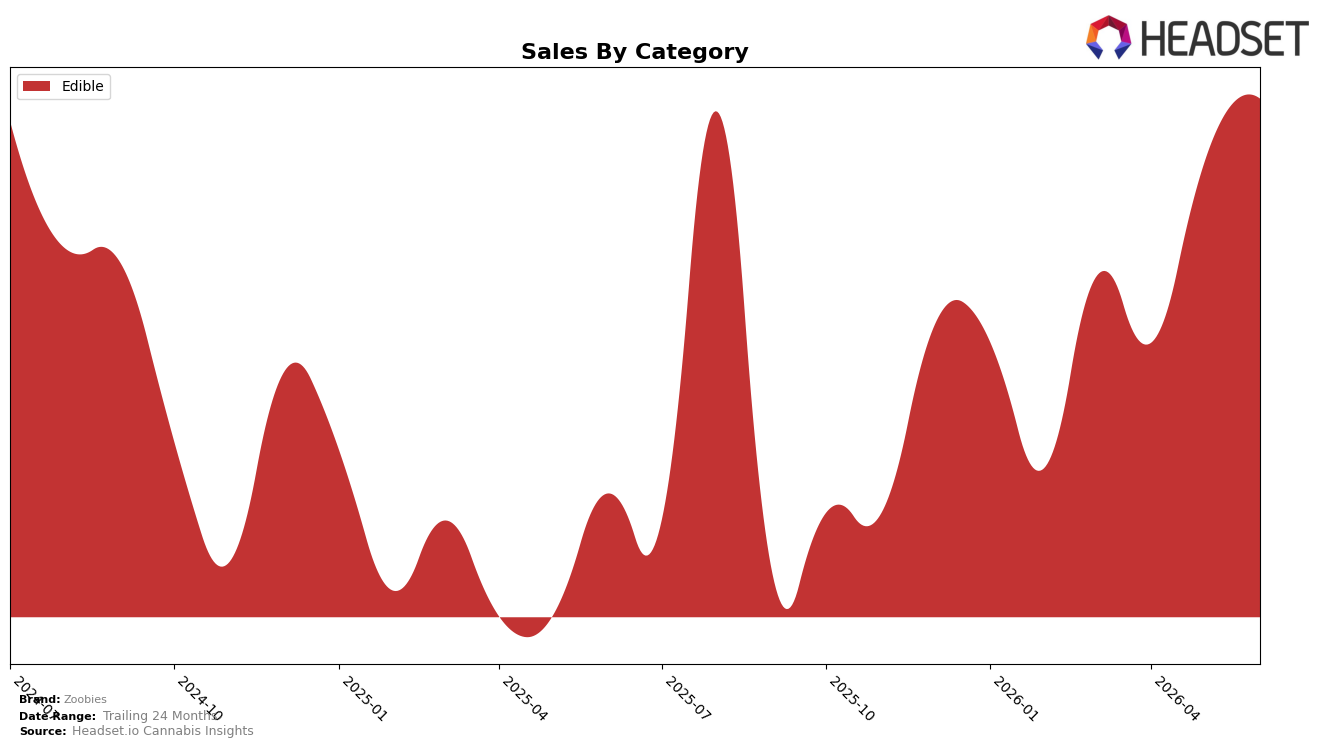
In June 2026, Zoobies operated as a single-category brand, with Edible accounting for 100.0% of sales and a month-over-month change of 6.03% alongside a year-over-year change of 55.10%. Average price rose 77.26% year over year to $10.12, while overall brand sales grew 55.10% year over year and 6.03% month over month within Edible, indicating demand held despite price inflation. With Edible at 100.0% share and rank 17 in Edible in New Jersey, the data implies a concentrated bet on a single format where pricing power did not materially dampen volume, positioning June 2026 as a test of depth rather than breadth.
These shifts imply Zoobies is leaning into price-led value capture within a single-category footprint, where a 77.26% price lift coexists with a 55.10% year-over-year sales increase and a 6.03% month-over-month gain, suggesting elasticity remains favorable at current price tiers. Holding rank 17 in Edible in New Jersey while Edible represents 100.0% of mix indicates room to trade up within the category hierarchy, and the June 2026 momentum implies the brand’s near-term upside is more likely to come from mix premiumization inside Edible than from cross-category expansion.
Competitive Landscape
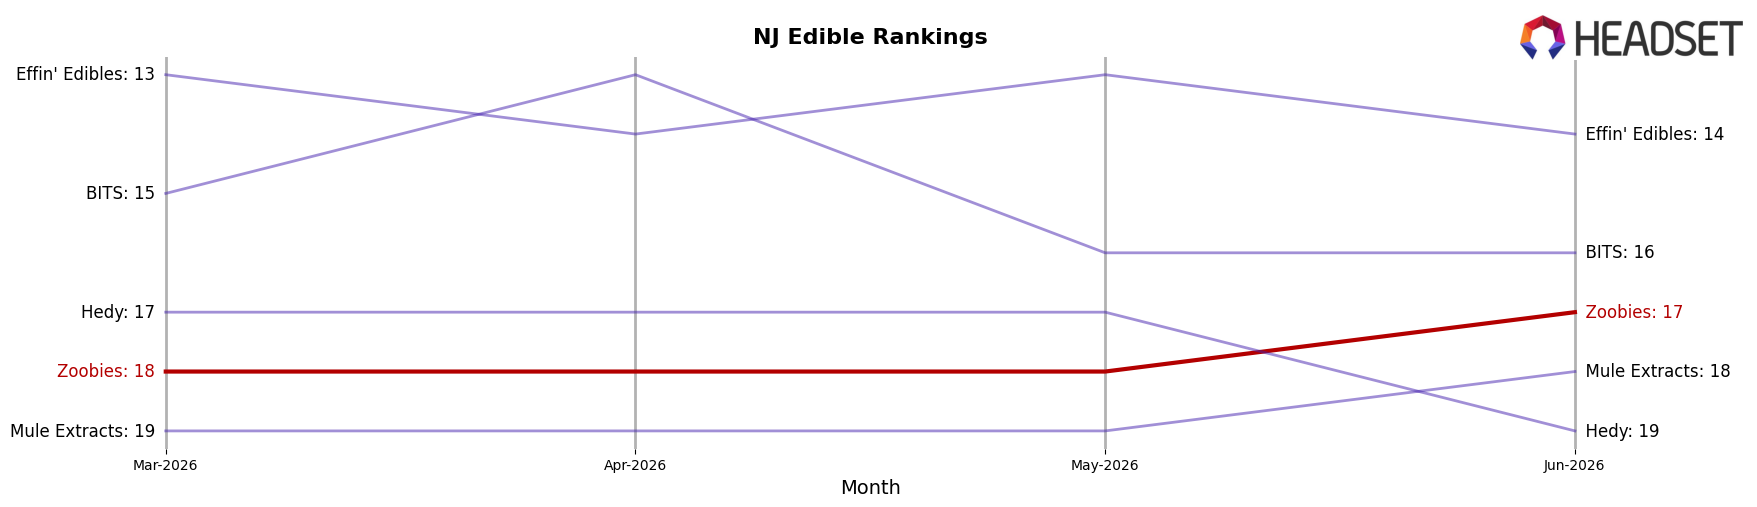
Zoobies ranks #17 in New Jersey Edible in June 2026, improving 17 positions from #34 year over year, while slipping 1 spot from #18 three months ago; its historical peak was #15 in June 2024, placing the current #17 two ranks below that high. Against this backdrop, Wyld climbed from #4 to #2 year over year as its sales rose 28.1%, whereas Select held at #3 but with a 25.9% sales decline, indicating that Zoobies is gaining rank amid mixed top-tier momentum and could convert incremental rank wins into sustained mid-tier presence if it stabilizes quarter-on-quarter slippage.
Notable Products
Sativa Mixed Fruit RSO Gummies 10-Pack (100mg) posted the steepest decline in June 2026 at -16.4% MoM while slipping to rank 4, and CBD/CBN/THC 1:1:1 Midnight Fruit Gummies 10-Pack (50mg CBD, 50mg CBN, 50mg THC) fell -19.3% MoM at rank 7; in contrast, Indica Sour Fruit Gummies 10-Pack (100mg) climbed +23.7% MoM yet remained at rank 3. Hybrid Mixed Fruit RSO Gummies 10-Pack (100mg) stayed at rank 1 with +4.6% MoM and approximately $61,311 in sales, and Mixed Fruit Gummies (100mg) advanced +10.3% MoM at rank 2. Eight of the top ten are Edible gummies, and the RSO-labeled variants occupy three of the top five positions, concentrating demand at the value end even as sleep/cannabinoid-blend formats retrench. The pattern implies Zoobies is consolidating around mainstream fruit gummies with RSO-led volume while rethinking sleep and Sativa-forward SKUs that are losing momentum.
Top Selling Cannabis Brands
Data for this report comes from real-time sales reporting by participating cannabis retailers via their point-of-sale systems, which are linked up with Headset’s business intelligence software. Headset’s data is very reliable, as it comes digitally direct from our partner retailers. However, the potential does exist for misreporting in the instance of duplicates, incorrectly classified products, inaccurate entry of products into point-of-sale systems, or even simple human error at the point of purchase. Thus, there is a slight margin of error to consider. Brands listed on this page are ranked in the top twenty within the market and product category by total retail sales volume.

