Market Insights Snapshot
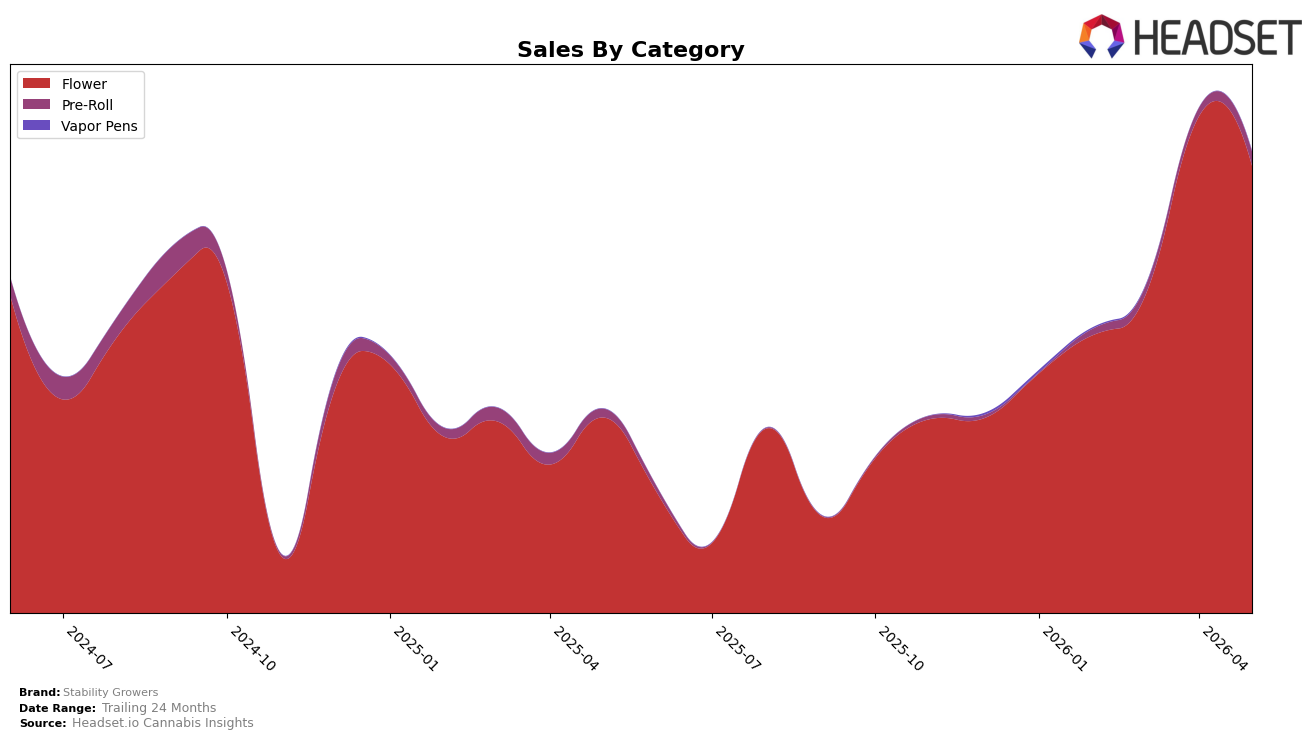
In May 2026, Stability Growers derived 96.87% category share from Flower with year-over-year growth of 128.93% but a month-over-month decline of 9.87%, while Pre-Roll rose to 2.99% share on 65.01% YoY and 67.44% MoM growth. Vapor Pens remained marginal at 0.14% share with no measurable YoY or MoM signal, and the brand’s average price fell 34.68% YoY to $18.40 as Flower averaged $19.64 and Pre-Roll averaged $6.00. The mix tilts heavily toward Flower despite short-term contraction and aggressive price compression, implying a volume-led strategy concentrated in a single category with early diversification via rapidly expanding Pre-Rolls.
Holding rank 19 in Flower in Missouri alongside 126.62% brand-level YoY sales growth and a 54.78% two-year increase suggests price elasticity is currently favorable, but dependence on a 96.87% Flower mix raises exposure to category-specific volatility. The 67.44% MoM surge in Pre-Roll share against a 9.87% MoM decline in Flower indicates incremental gains are coming from format breadth rather than premiumization, and a 34.68% YoY price drop signals the positioning is migrating toward value. This pattern implies near-term share defense through price-accessible Flower while building a secondary Pre-Roll pillar to de-risk the mix without relying on higher-price Vapor Pens.
Competitive Landscape
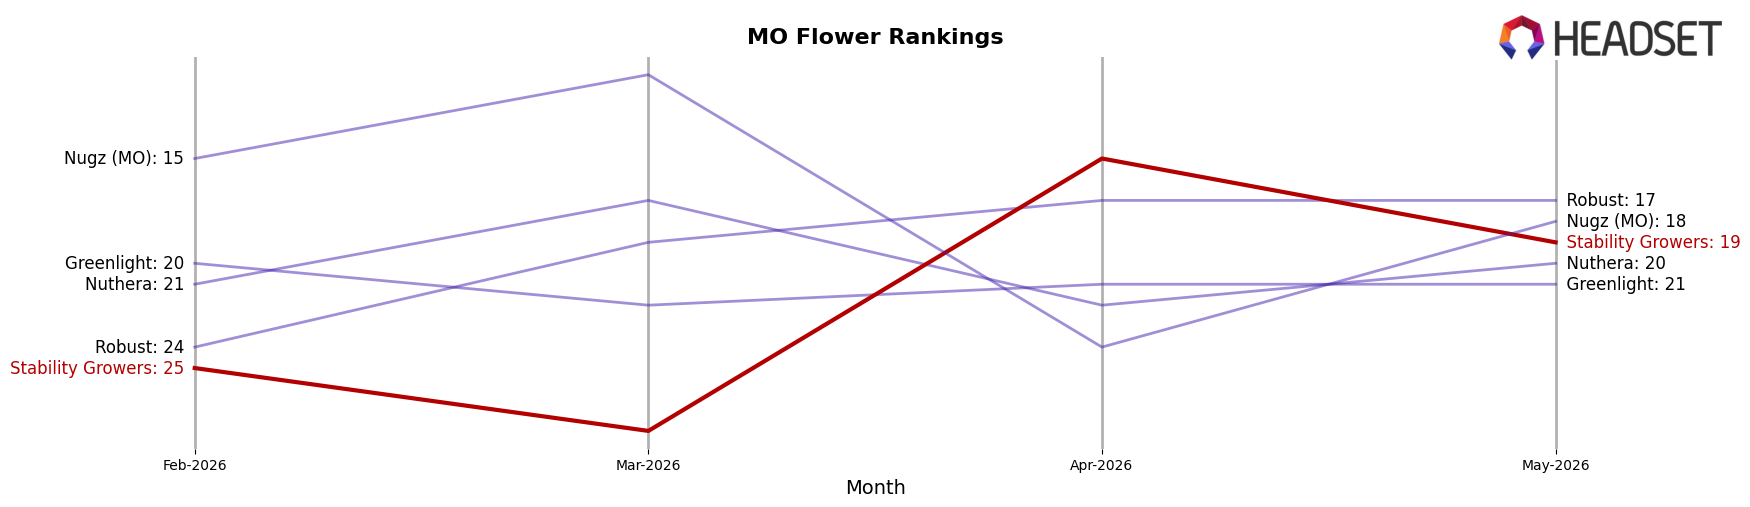
Stability Growers sits at rank #19 in MO Flower for May 2026, improving 14 positions from #33 year over year, while slipping 4 spots from #15 at its April 2026 peak and down 6 places from #13 if comparing peak to the current #19; versus peers, Flora Farms held #1 both this year and last year despite a -17.8% YoY sales change, and Illicit / Illicit Gardens climbed from #3 to #2 as its sales rose 5.8% YoY, indicating competitors are gaining or defending share even with mixed growth rates; the combination of a 14-rank YoY rise to #19 and a 4-rank pullback from the April 2026 peak implies Stability Growers is transitioning from rebound to consolidation, with near-term trajectory dependent on sustaining momentum against leaders that are either moving up in rank or holding top positions.
Notable Products
GMO (Bulk) posted the steepest movement in May 2026 at -74.7% MoM while falling to rank 7, whereas Fritter Glitter (3.5g) jumped 57.9% MoM to enter the top 10 at rank 10. Wi-Fi OG (3.5g) held rank 1 despite a -17.2% MoM dip, and Gary Poppins (3.5g) slid to rank 2 with a -37.6% MoM change. With all top-10 entries in Flower and one bulk SKU collapsing as a 3.5g SKU surged, the mix points to a pivot toward packaged 3.5g formats over bulk in near-term merchandising.
Top Selling Cannabis Brands
Data for this report comes from real-time sales reporting by participating cannabis retailers via their point-of-sale systems, which are linked up with Headset’s business intelligence software. Headset’s data is very reliable, as it comes digitally direct from our partner retailers. However, the potential does exist for misreporting in the instance of duplicates, incorrectly classified products, inaccurate entry of products into point-of-sale systems, or even simple human error at the point of purchase. Thus, there is a slight margin of error to consider. Brands listed on this page are ranked in the top twenty within the market and product category by total retail sales volume.

