Jun-2026
Sales
Trend
6-Month
Product Count
SKUs
Avg Price
YoY Sales Change
YoY Price Change
Market Insights Snapshot
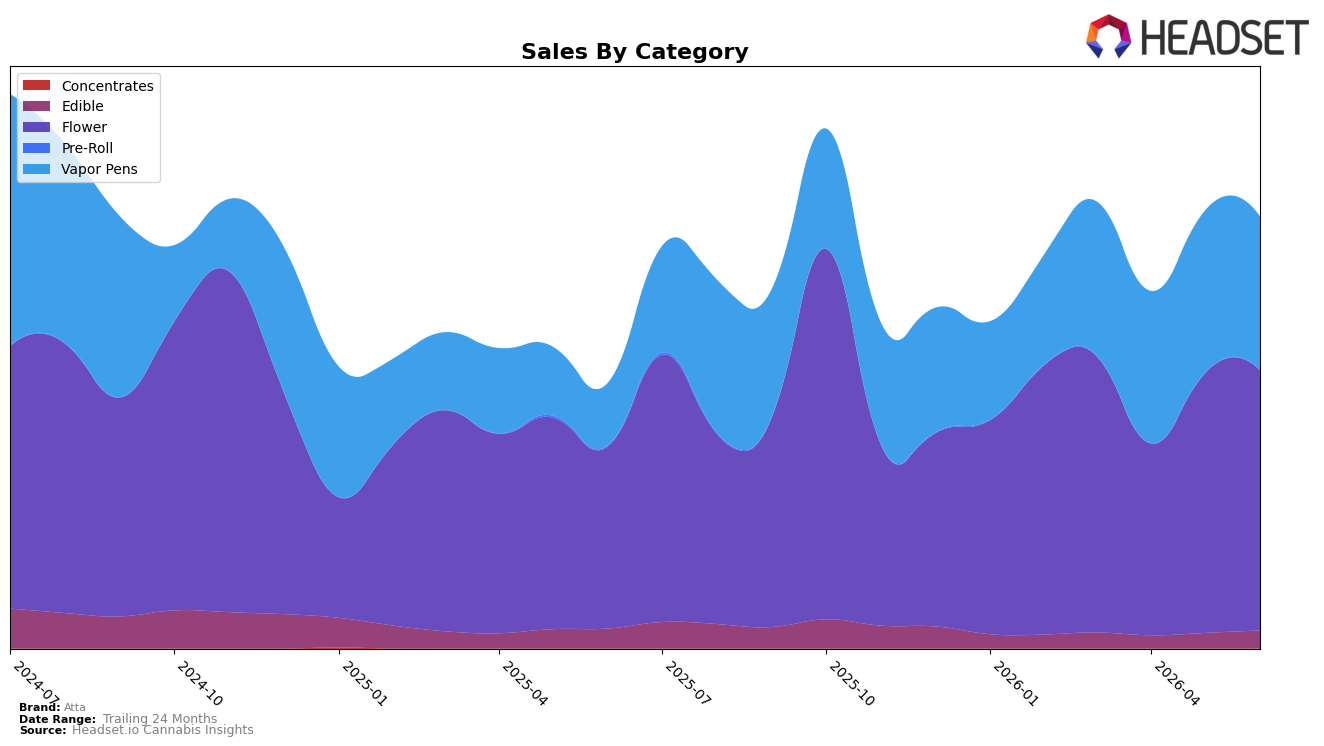
Atta concentrated 60.33% of June 2026 sales in Flower with 0.41% MoM growth and 42.76% YoY, while Vapor Pens carried 35.57% share with a -5.38% MoM dip against a 145.67% YoY surge; Edible held 4.09% share with 15.94% MoM growth despite a -10.52% YoY decline, and Pre-Roll collapsed to 0.01% share with -78.03% MoM and -95.18% YoY. The average price climbed 17.19% YoY to $30.64 as Flower averaged $36.50 and Vapor Pens $26.18, indicating mix-shift inflation alongside category bifurcation. The pattern implies a dual-engine portfolio where Flower provides volume stability and Vapor Pens drive annual expansion, but recent month-to-month softness in Vapor Pens and near-elimination of Pre-Roll signal exposure to short-term demand swings if Flower momentum cools.
With Flower ranked 23 in Missouri and holding 60.33% share, Atta’s positioning skews toward mid-pack scale dependent on Flower price realization (+17.19% YoY overall pricing) and Vapor Pen velocity (+145.67% YoY) rather than breadth. The 15.94% MoM lift in Edible at just 4.09% share and the -5.38% MoM in Vapor Pens indicate that small reallocations can swing month outcomes more than rank shifts at 23, so sustaining Flower’s 0.41% MoM while stabilizing Vapor Pens becomes the lever to raise category standing; the implication is to treat Edible as a volatility buffer while Pre-Roll’s -95.18% YoY exit reduces trial on-ramps that typically feed Flower and Vapor Pen upsell.
Competitive Landscape
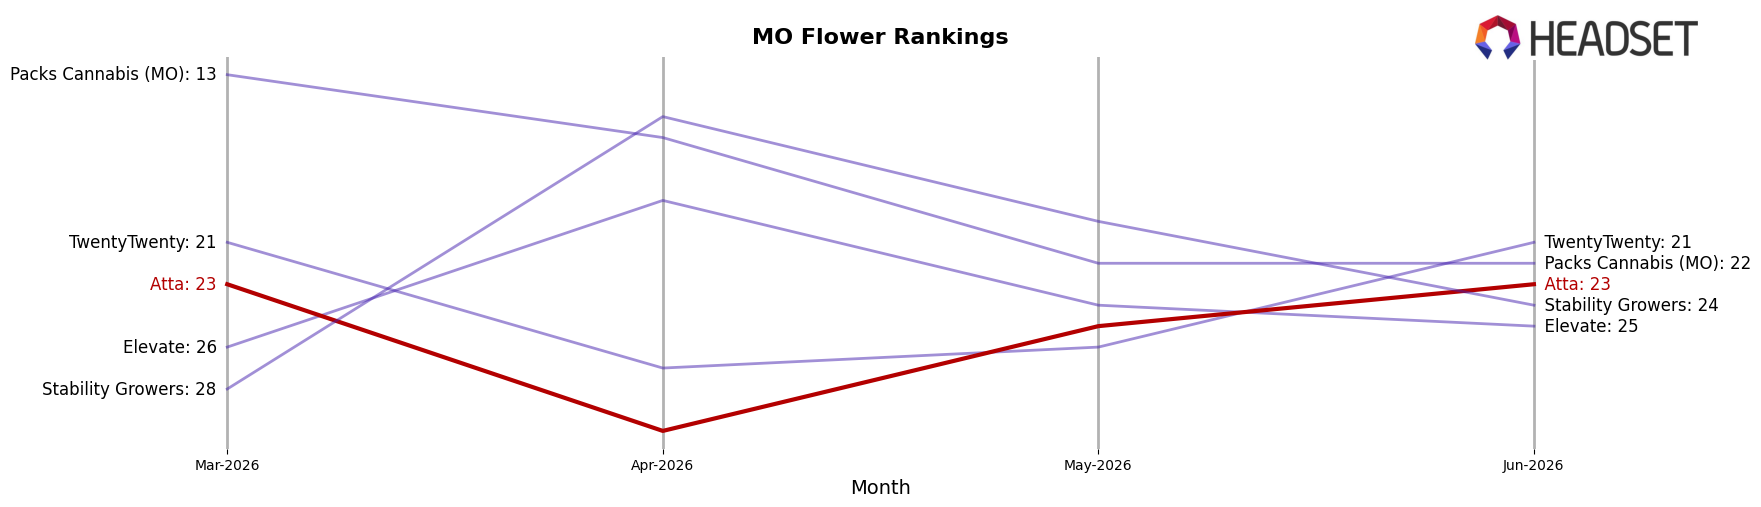
Atta sits at rank #23 in MO Flower for June 2026, improving 8 positions YoY from #31, while holding flat versus March 2026 at #23; this stability contrasts with Sinse Cannabis climbing from #5 to #2 YoY and Amaze Cannabis rising from #6 to #4 with a 43.8% YoY sales gain as of June 2026. Atta’s peak position of #16 in October 2025 and subsequent reversion to #23 by June 2026, alongside Flora Farms holding #1 despite a 5.1% YoY sales dip and Local Cannabis Co. advancing from #10 to #5 with a 28.3% YoY gain, indicates Atta’s rank recovery is driven by incremental share defense rather than breakout momentum amid faster-moving rivals.
Notable Products
Mango Tango Triple Pass Distillate Cartridge (1g) posted the steepest move in June 2026 with a -21.1% MoM drop while sitting at rank 10, contrasted by Blue Dream Distillate Cartridge (1g) falling -14.3% at rank 3; meanwhile, Super Snocone Distillate Cartridge (1g) rose +19.2% at rank 1 and Badass Blueberry Distillate Cartridge (1g) gained +20.5% at rank 6. Vapor Pens account for eight of the top ten SKUs, and within that cluster ranks 1, 3, 5, 6, 7, 9, and 10 collectively point to bifurcation where leaders advance double digits while mid-pack entries contract by -14% to -21%. The coexistence of a +19% leader at the top and double-digit declines in two top-10 pens indicates SKU churn rather than category weakness, especially with Jack Herer Triple Pass Distillate Cartridge (1g) holding rank 9 on a +5.0% MoM uptick. This pattern implies Atta is consolidating share around a few high-velocity Vapor Pens while pruning or repricing lagging variants to tighten the lineup and protect mix margin.
Top Selling Cannabis Brands
Data for this report comes from real-time sales reporting by participating cannabis retailers via their point-of-sale systems, which are linked up with Headset’s business intelligence software. Headset’s data is very reliable, as it comes digitally direct from our partner retailers. However, the potential does exist for misreporting in the instance of duplicates, incorrectly classified products, inaccurate entry of products into point-of-sale systems, or even simple human error at the point of purchase. Thus, there is a slight margin of error to consider. Brands listed on this page are ranked in the top twenty within the market and product category by total retail sales volume.

