Jun-2026
Sales
Trend
6-Month
Product Count
SKUs
Avg Price
YoY Sales Change
YoY Price Change
Market Insights Snapshot
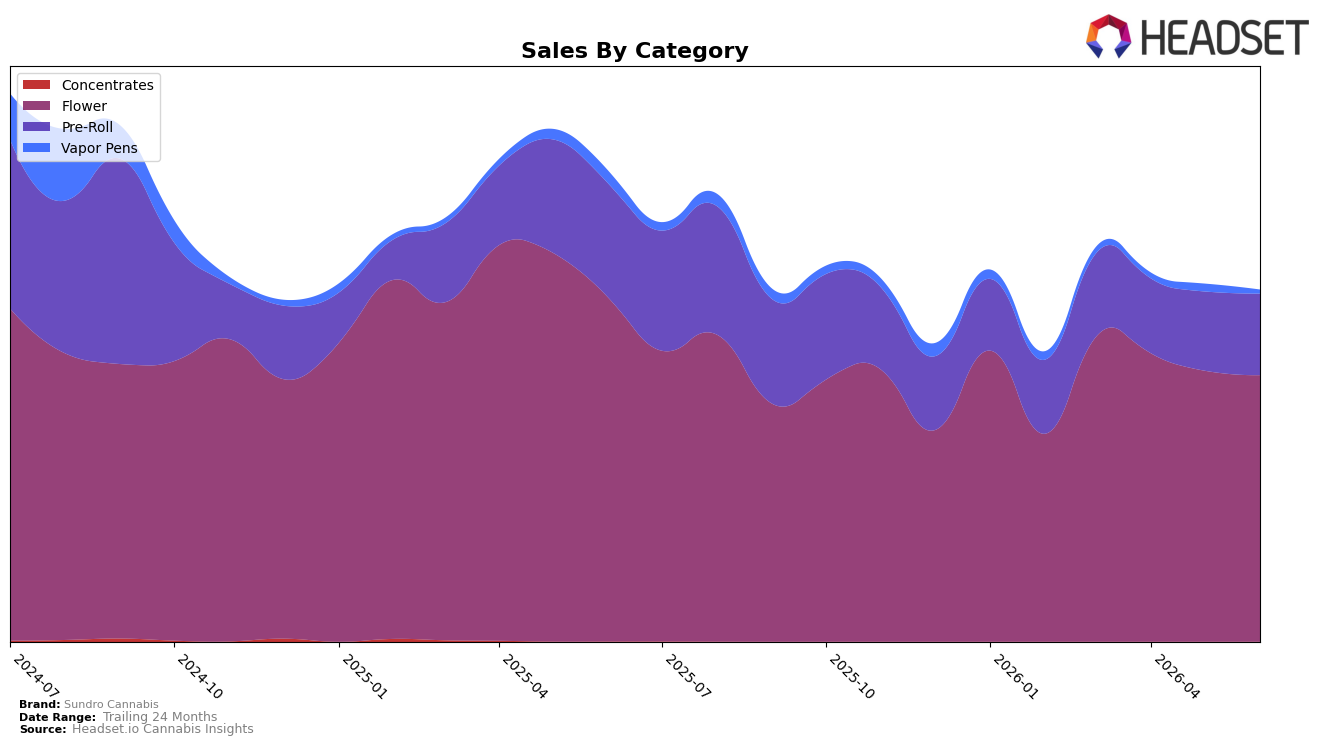
In June 2026, Sundro Cannabis concentrated 75.82% of sales in Flower with a year-over-year decline of 22.49% and a month-over-month dip of 1.64%, while Pre-Roll held 23.11% share with a 28.68% YoY decrease but a 2.87% MoM uptick; Vapor Pens shrank to 1.07% share with a 69.93% YoY and 49.97% MoM drop. The brand’s average price fell 14.85% YoY to $20.52, and within the mix, Flower’s average price sat at $25.32 versus Pre-Roll at $12.51, indicating volume reliance on lower-priced formats as sales fell 25.29% YoY across the brand. The pattern implies a margin squeeze risk as the category mix leans on Pre-Roll for incremental MoM growth while the core Flower engine softens, with minimal hedge from Vapor Pens.
Positionally, a 31 rank in Flower in Missouri alongside a 22.49% YoY contraction in that category and a 1.64% MoM dip suggests reduced shelf momentum in the core lane, while the 2.87% MoM lift in Pre-Roll at 23.11% share points to near-term basket entry via value-oriented SKUs. With brand sales down 25.29% YoY and the 1.07% Vapor Pens share collapsing 49.97% MoM, the portfolio skews toward price-sensitive segments, implying the brand’s competitive stance tilts toward value defense rather than premium differentiation in June 2026.
Competitive Landscape
Sundro Cannabis sits at rank #31 in MO Flower in June 2026, down 7 positions year over year from #24 and slipping 2 spots since March 2026 from #29, while its historical peak of #20 in May 2025 underscores a 11-rank slide from peak to current. In contrast, Flora Farms held #1 year over year and remains #1 despite a 5.1% YoY sales decline, and Sinse Cannabis advanced from #5 YoY to #2 with 33.2% sales growth; meanwhile, Amaze Cannabis moved from #6 YoY to #4 with 43.8% growth. The pattern—down 7 ranks YoY and 2 ranks in the last three months while competitors climb multiple positions—implies Sundro Cannabis is losing relative velocity in Missouri Flower and must reverse share losses to re-approach its #20 peak.

Notable Products
Bunny Runtz (3.5g) posted the standout move in June 2026 with an 86.1% month-over-month increase and a jump to rank 1, while Bitter Sweet (3.5g) fell 51.4% and slid to rank 9. Animal Iccee (3.5g) dipped 8.9% yet held rank 2, and Runtz (3.5g) declined 47.9% to rank 4. With six of the top ten SKUs in Flower and only one Pre-Roll posting a double-digit gain at 20.9% from rank 10, the mix points to a pivot toward a single flagship Flower driver rather than balanced breadth.
Top Selling Cannabis Brands
Data for this report comes from real-time sales reporting by participating cannabis retailers via their point-of-sale systems, which are linked up with Headset’s business intelligence software. Headset’s data is very reliable, as it comes digitally direct from our partner retailers. However, the potential does exist for misreporting in the instance of duplicates, incorrectly classified products, inaccurate entry of products into point-of-sale systems, or even simple human error at the point of purchase. Thus, there is a slight margin of error to consider. Brands listed on this page are ranked in the top twenty within the market and product category by total retail sales volume.

