Jun-2026
Sales
Trend
6-Month
Product Count
SKUs
Avg Price
YoY Sales Change
YoY Price Change
Market Insights Snapshot
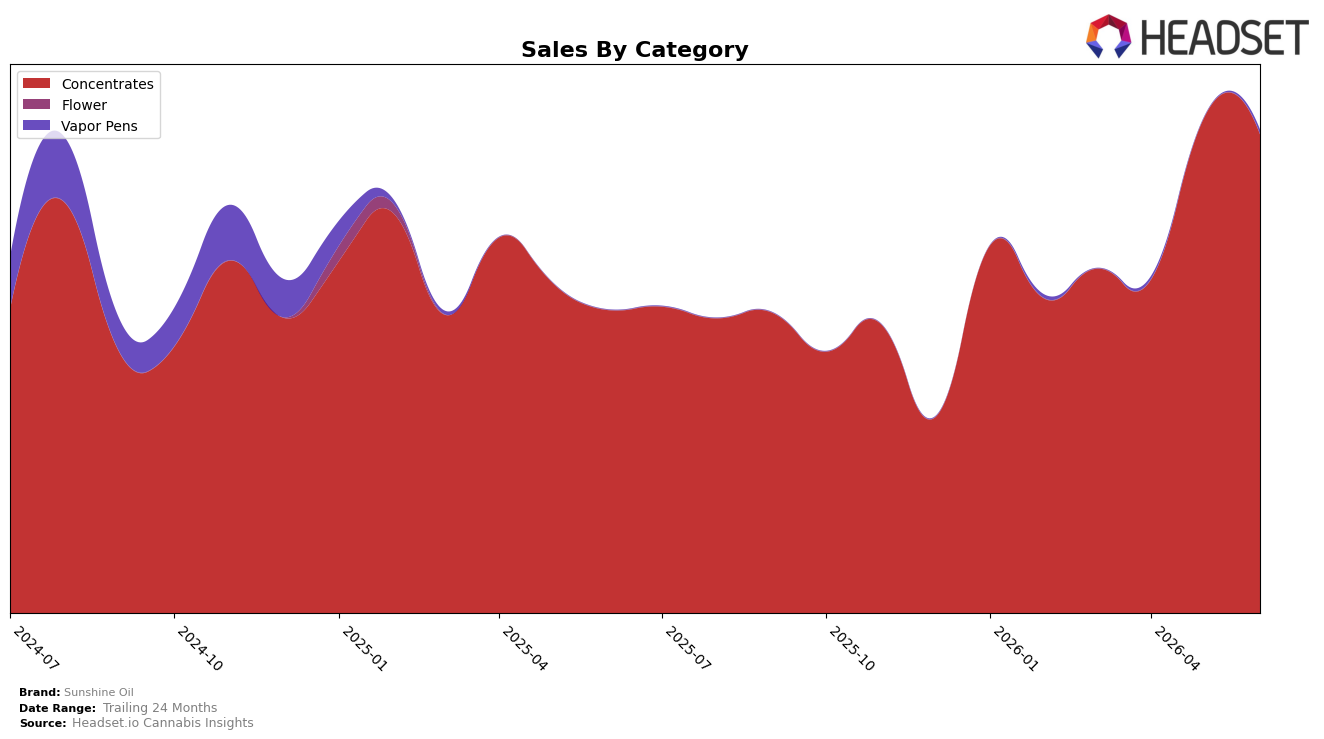
Sunshine Oil concentrated 99.15% of June 2026 sales in Concentrates, with Vapor Pens at 0.85%, indicating a near-single-category footprint. Within Concentrates, year-over-year sales rose 58.08% while month-over-month slipped 3.59%, and the brand’s overall sales were up 59.44% YoY alongside a 33.27% YoY lift in average price, implying volume held even as pricing rose. Vapor Pens expanded month-over-month by 1,259.60% from a small base to 0.85% share, versus Concentrates’ MoM decline of 3.59%, which implies experimentation outside the core is offsetting some intra-month softness in the primary category.
Positioning-wise, a 99.15% share in Concentrates with a state-category rank of 10 in Oregon places Sunshine Oil as a focused player whose growth is still tied to a single aisle, while the 0.85% Vapor Pens share and 1,259.60% MoM surge signal early-stage hedging. The combination of a 33.27% YoY price increase and a 58.08% YoY category gain suggests headroom for premiumization within Concentrates, yet the 3.59% MoM dip indicates sensitivity to short-cycle demand, implying the brand can use Pens as a tactical buffer while defending a top-10 Concentrates position.
Competitive Landscape
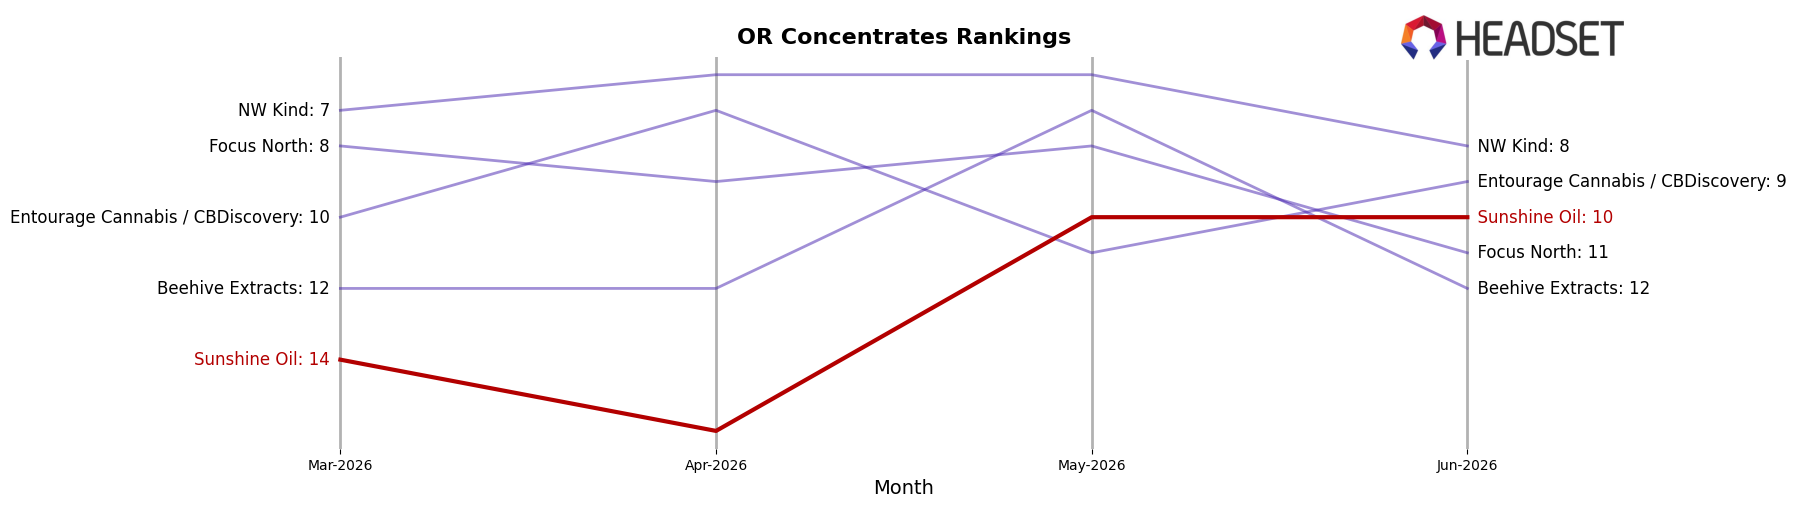
Sunshine Oil sits at rank #10 in Oregon Concentrates in June 2026, improving 7 positions year over year from #17 and rising 4 spots since March 2026 from #14, which marks a new peak rank of #10 in June 2026; this upward move contrasts with Altered Alchemy holding #1 while posting a -9.7% YoY sales change and Oregrown climbing from #3 to #2 alongside a 153.4% YoY sales increase. With Buddies advancing from #8 to #4 and White Label Extracts (OR) slipping from #4 to #5 amid a -2.6% YoY change, Sunshine Oil’s ascent into the top 10 despite accelerating competitors indicates a momentum phase that, if maintained, positions the brand to contest ranks #8–#9 next.
Notable Products
Blue Jack Crumble (2g) posted the most pronounced move in June 2026 with a month-over-month gain of 70.4% and climbed to rank 2, outpacing Grape Sour Crumble (2g) despite its own 54.4% increase at rank 1; this divergence indicates momentum concentrating at the very top rather than diffusing across the lineup. Maui Trueblood Sugar Wax (2g) fell 14.5% while holding rank 3, and Tropicana Sugar Wax (2g) slid 28.2% to rank 10 as Devil Fruit Crumble (2g) declined 26.9% at rank 9, signaling a bifurcation where winners expand share as laggards contract. Eight of the top ten are Concentrates SKUs, and with Grape Sour Crumble (2g) generating $16,326 alongside double-digit growth leaders, the skew toward crumble formats over sugar wax suggests Sunshine Oil is consolidating around higher-velocity concentrate variants to anchor near-term assortment priorities.
Top Selling Cannabis Brands
Data for this report comes from real-time sales reporting by participating cannabis retailers via their point-of-sale systems, which are linked up with Headset’s business intelligence software. Headset’s data is very reliable, as it comes digitally direct from our partner retailers. However, the potential does exist for misreporting in the instance of duplicates, incorrectly classified products, inaccurate entry of products into point-of-sale systems, or even simple human error at the point of purchase. Thus, there is a slight margin of error to consider. Brands listed on this page are ranked in the top twenty within the market and product category by total retail sales volume.

