.svg)



Market Insights Snapshot
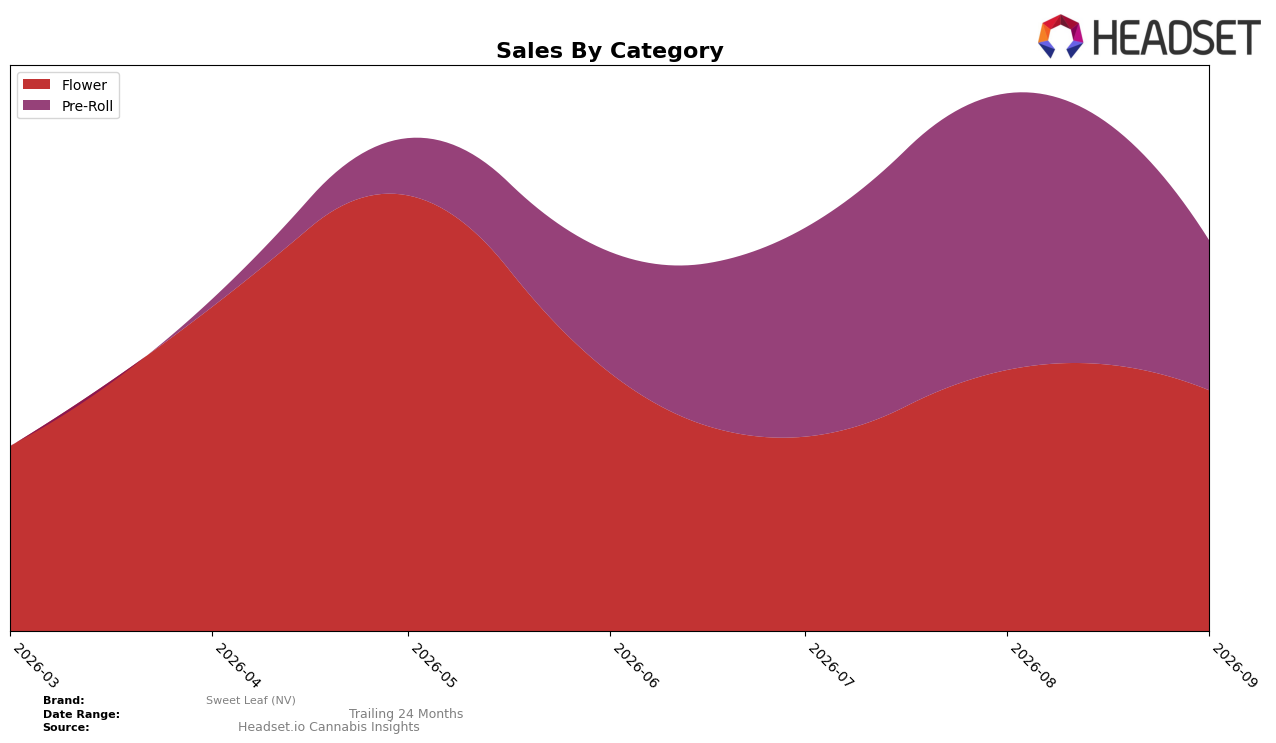
In September 2026, Sweet Leaf (NV) concentrated 61.39% of sales in Flower and 38.61% in Pre-Roll, a split that shifted month over month as Flower declined 7.68% while Pre-Roll contracted 45.15%. The average price sat at $11.82 across the brand, with Flower averaging $18.52 and Pre-Roll at $7.51, framing a clear price-tier bifurcation that coincided with the sharper Pre-Roll volume pullback. Within Nevada Flower, the brand held rank 64, a position that, paired with a 61.39% mix weight and a 7.68% MoM dip, implies reliance on a category where even small share losses can disproportionately affect total throughput.
The mix pivot toward Flower amid a 45.15% MoM contraction in Pre-Roll signals a re-centering on higher-ticket units, but the rank 64 standing in Nevada Flower suggests limited visibility if the 7.68% MoM decline persists. With 38.61% of revenue tied to lower-price Pre-Rolls at $7.51 versus $18.52 in Flower, the brand’s price architecture risks compressing traffic when value-driven segments soften, so sustaining share requires either stabilizing Pre-Roll velocity or lifting Flower ranking from 64 to offset a shrinking MoM contribution.
Competitive Landscape
Sweet Leaf (NV) sits at rank #64 in Nevada Flower for September 2026, moving up 2 positions from #66 in June 2026, while its peak at #57 in May 2026 marks a 7-rank slip from that high. At the top end, RYTHM holds #1 with a 19.7% year-over-year sales increase, and STIIIZY remains #2 with 24.2% YoY growth, whereas Alternative Medicine Association / AMA advanced from #5 to #3 alongside 32.6% YoY growth. The combination of Sweet Leaf (NV)’s short-term +2-rank lift since June 2026 and a -7-rank gap from its May 2026 peak implies stabilization off the peak rather than a renewed climb toward the top tier.

Notable Products
Baja Blasteroid Pre-Roll (1g) posted the largest move in September 2026 with a 117.6% month-over-month jump and climbed to rank 6, while GovernMint Oasis Pre-Roll (1g) plunged 70.4% to rank 4 despite sitting above it in placement, indicating volatility within Pre-Rolls driven by SKU-specific swings. Don Mega Pre-Roll (1g) still held rank 1 but fell 30.4%, and Sweet Leaf (NV) had six Flower SKUs in the top ten alongside three Pre-Rolls, implying the portfolio is tilting toward breadth in Flower while relying on a single flagship in Pre-Rolls for headline rank stability. Baja Blasteroid (3.5g) rose 28.4% to rank 3 as Cartel Runtz (3.5g) gained 21.5% at rank 2, and Governmint Oasis (3.5g) fell 54.6% at rank 5 with Purple Gas (3.5g) down 53.0% at rank 7, indicating a bifurcation where select eighths are gaining share while legacy or value Flower formats lose momentum; this mix suggests Sweet Leaf (NV) is pivoting toward a smaller set of outperforming strains rather than chasing depth across every SKU and size tier.
Top Selling Cannabis Brands






Data for this report comes from real-time sales reporting by participating cannabis retailers via their point-of-sale systems, which are linked up with Headset’s business intelligence software. Headset’s data is very reliable, as it comes digitally direct from our partner retailers. However, the potential does exist for misreporting in the instance of duplicates, incorrectly classified products, inaccurate entry of products into point-of-sale systems, or even simple human error at the point of purchase. Thus, there is a slight margin of error to consider. Brands listed on this page are ranked in the top twenty within the market and product category by total retail sales volume.

