.svg)

Sep-2026
Sales
Trend
6-Month
Product Count
SKUs
Avg Price
YoY Sales Change
YoY Price Change


Where to Buy
Alternative Medicine Association / AMA is stocked at 84 licensed dispensaries across Nevada and Michigan, 83 of them in Nevada, with the deepest coverage in Las Vegas, Reno, Henderson, North Las Vegas, and Sparks. Search by ZIP code or city below to find the closest one, or filter by product type if you are after a specific format.
Market Insights Snapshot
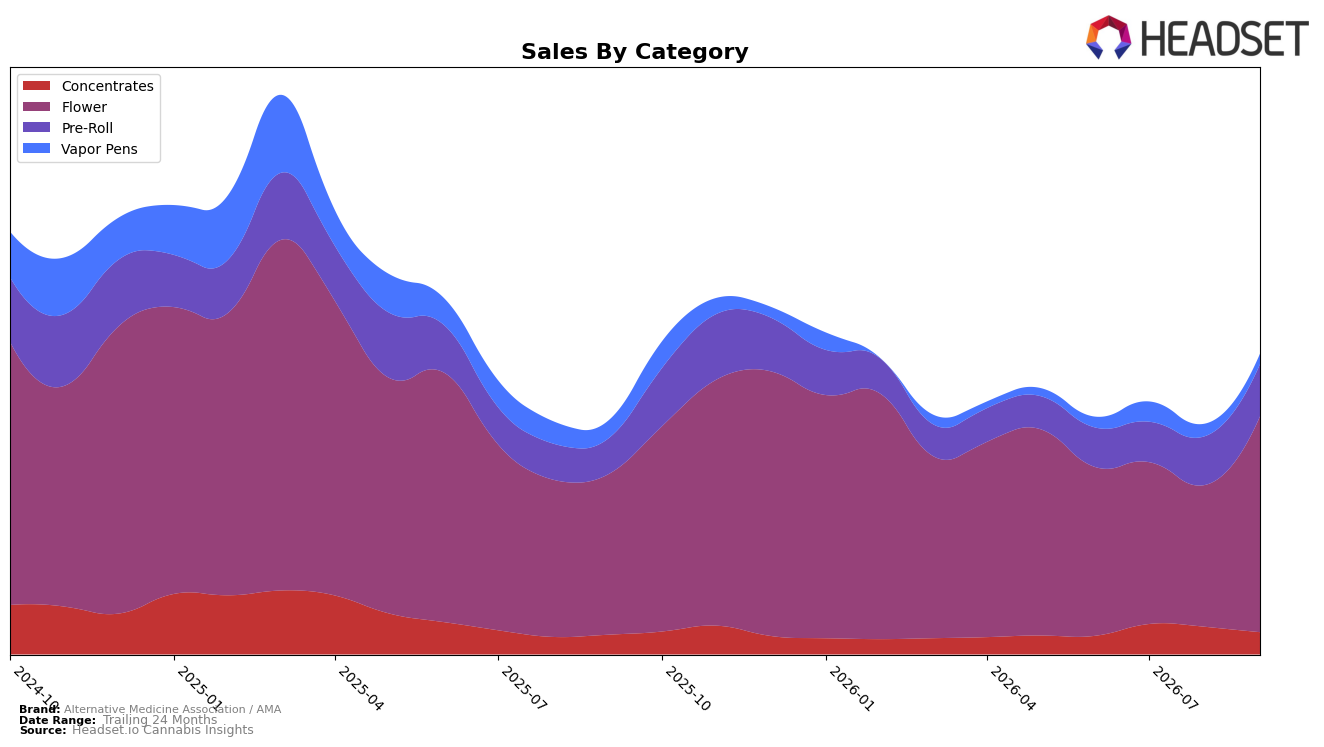
In September 2026, Alternative Medicine Association / AMA concentrated 66.44% of sales in Flower, with Pre-Roll at 18.22% and Concentrates at 9.41%, while Vapor Pens held 5.93%; this mix shifted on both a year-over-year basis and month-over-month as Flower expanded 32.55% YoY and 48.97% MoM, and Pre-Roll grew 36.33% YoY and 5.86% MoM, against a contraction in Vapor Pens of -26.96% YoY and -9.35% MoM and a MoM dip in Concentrates of -14.57% despite 8.66% YoY growth. The category tilt coincides with a 19.32% YoY increase in average price alongside overall brand sales up 24.58% YoY and ranked 3 in Flower in Nevada, implying that September 2026 performance is being pulled by higher-priced Flower and steady Pre-Roll, while weakening demand in Vapor Pens and a short-term pullback in Concentrates cap diversification.
The widening reliance on Flower, combined with Pre-Roll resilience, suggests a price-accepting consumer base gravitating toward traditional inhalables, as evidenced by Flower’s 48.97% MoM surge and rank 3 position in Nevada alongside a 36.33% YoY rise in Pre-Roll; however, the -26.96% YoY and -9.35% MoM declines in Vapor Pens and the -14.57% MoM dip in Concentrates indicate portfolio vulnerability if inhalable preferences rotate. With brand sales up 24.58% YoY but down -16.81% over 24 months and average price up 19.32% YoY, the pattern implies AMA’s near-term positioning is anchored in premium-leaning Flower scale and add-on Pre-Roll units, while lagging Vapor Pens and inconsistent Concentrates create a trade-off between current share momentum and longer-term category balance.
Competitive Landscape
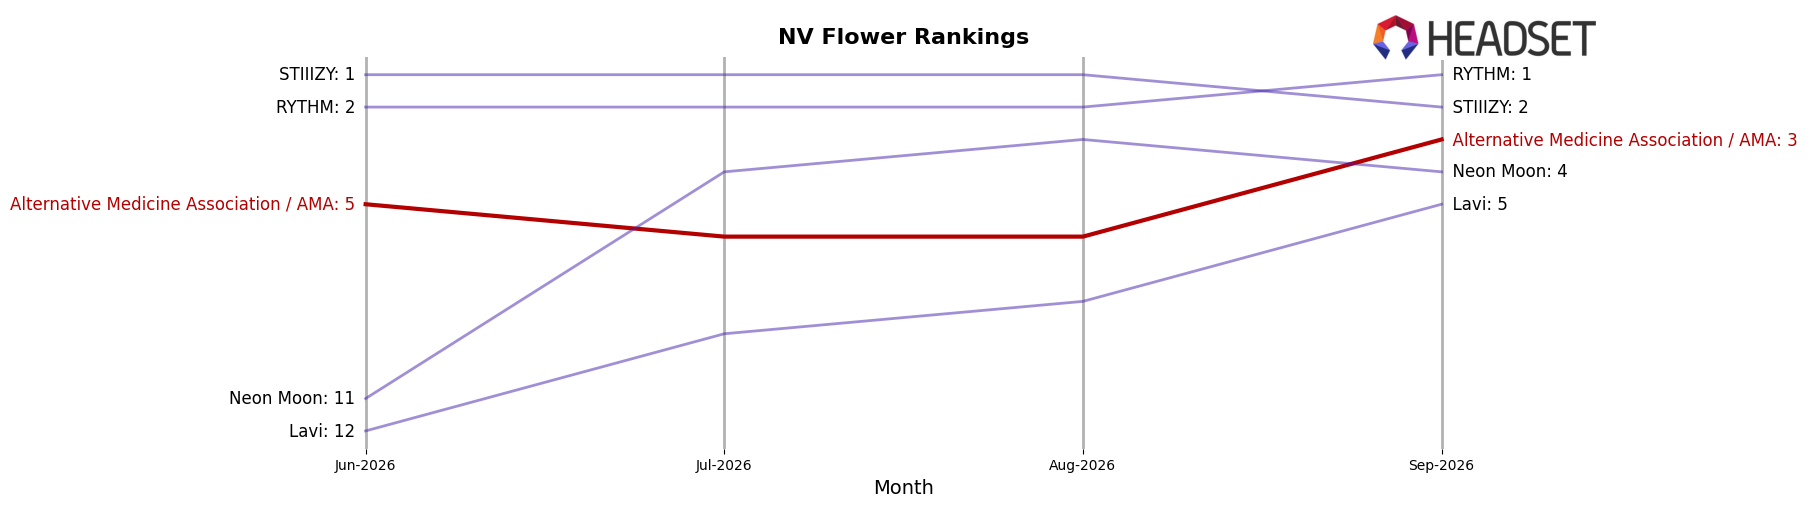
Alternative Medicine Association / AMA sits at rank #3 in NV Flower in September 2026, improving 2 positions YoY from #5 and rising 2 spots since June 2026, while its February 2026 peak at #1 contrasts with the current 2-rank gap to the top; in the same period, RYTHM held #1 YoY and remains #1, and STIIIZY stayed at #2 as of September 2026 with a 24.2% YoY sales lift versus Neon Moon jumping from #9 to #4 alongside an 82.7% YoY gain. The directional spread—AMA up 2 ranks YoY but displaced from its February 2026 #1 peak, while Neon Moon advanced 5 ranks and Lavi improved from #8 to #5 with a 33.8% YoY increase—implies AMA’s trajectory is positive but being compressed by faster-moving challengers, so maintaining a top-3 slot likely requires countering the upward momentum directly above and below it.
Notable Products
Cosmic Giggles Pre-Roll (1g) posted the steepest movement in September 2026 with a -69.99% month-over-month drop while sliding to rank 10, as Cap Junky Pre-Roll (1g) also contracted -55.61% yet held rank 1. In contrast, Double Rainbow Pre-Roll (1g) grew 6.40% month over month at rank 4, creating a bifurcation where three of the top ten are Pre-Roll SKUs concentrating volatility at the category’s top and bottom ranks. Kush Cake (14g) declined -15.89% to rank 5 as Cap Junky (14g) stabilized at rank 3, and four of the top ten are Flower SKUs that anchor mid-table consistency despite sharper Pre-Roll swings. The pattern implies Alternative Medicine Association / AMA is leaning on Flower for baseline volume while using selective Pre-Roll pushes to test momentum, suggesting a barbell mix that trades Pre-Roll risk for trial while Flower sustains core demand and dollar throughput, including $150,862 from Cap Junky (14g).
Top Selling Cannabis Brands






Data for this report comes from real-time sales reporting by participating cannabis retailers via their point-of-sale systems, which are linked up with Headset’s business intelligence software. Headset’s data is very reliable, as it comes digitally direct from our partner retailers. However, the potential does exist for misreporting in the instance of duplicates, incorrectly classified products, inaccurate entry of products into point-of-sale systems, or even simple human error at the point of purchase. Thus, there is a slight margin of error to consider. Brands listed on this page are ranked in the top twenty within the market and product category by total retail sales volume.

